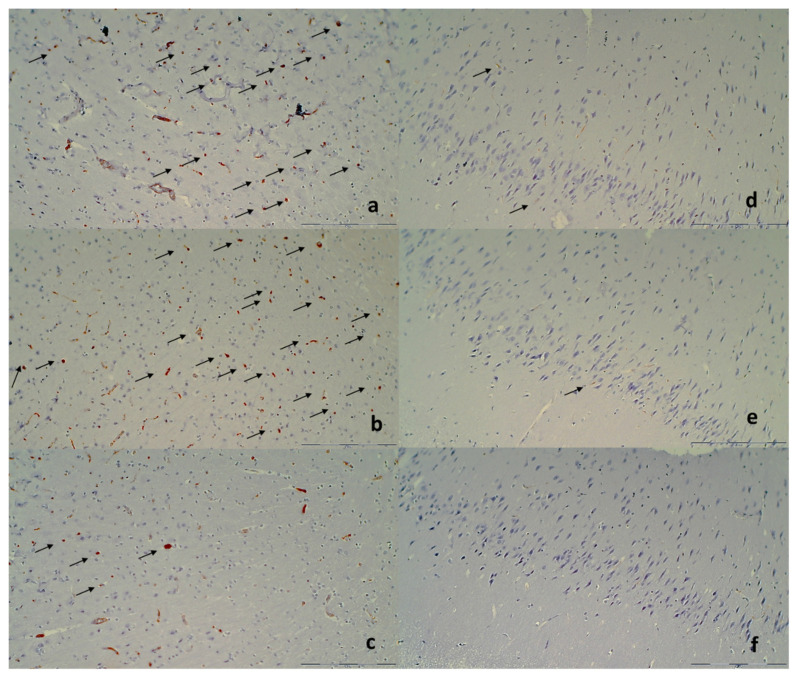
Figure 14.
Immunohistochemical staining of microglial cells (a,b) CD68 KP1, (c,d) CD68 (PG-M1), (e,f) CD163 (marked with arrows; magnification ×400). (a) Control group after 48 h showed increased number of CD68 KP1 positive microglia cells with an amoeboid morphology in gray matter (score 3), while (b) BPC 157 with less than 5 cells (score 1). (c) Control group after 48 h showed increased number of CD68 (PG-M1) positive M1 type microglia cells with an amoeboid morphology in gray matter (score 3), while (d) BPC 157 with less than 5 cells (score 1). (e) Control group after 48 h showed less than 5 CD163 M2 type microglia cells with an amoeboid morphology in gray matter (score 1), while (d) BPC 157 with no cells (score 1). Magnification ×200 (scale bar 100 µm; Olympus BX51 objective 20×; field area 1 mm2; Note: endothelial cells were immunohistochemically labeled with all three antibodies but were excluded from scoring).

