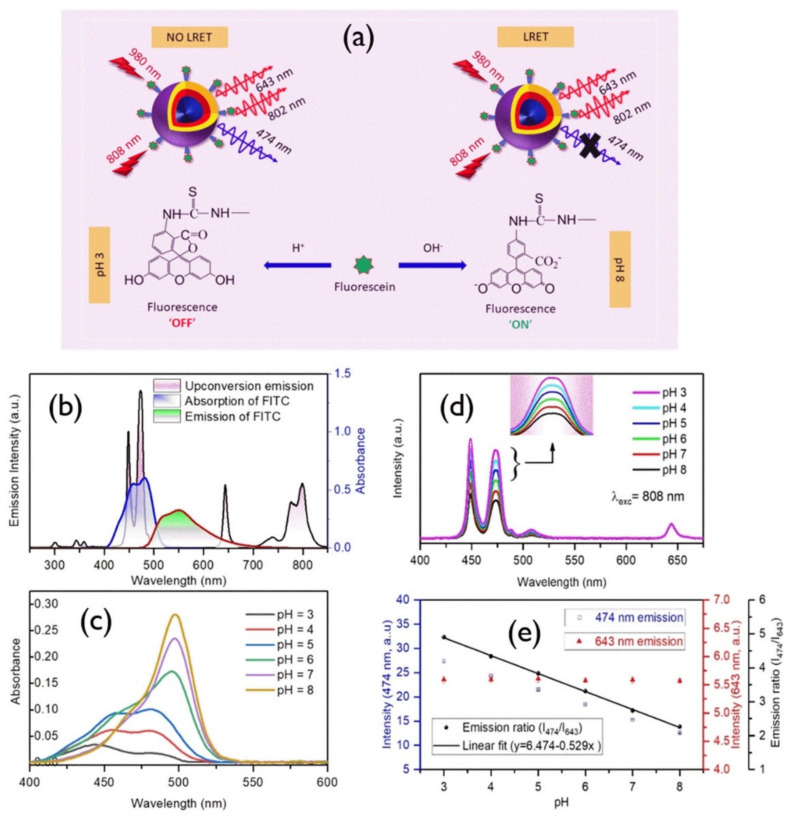
Figure 10.
(a) Schematic description of the developed nanoprobe and its working principle. (b) Black line, upconversion emission upon 980 nm; blue line, absorption spectrum of FITC; red line, FITC emission upon 488 nm laser excitation. (c) Absorption spectra of FITC in various pH values. (d) Variation of 808 nm excited upconversion emission spectra of FITC-conjugated core–shell–shell nanoprobes with pH; inset shows the 474 nm band. (e) Variation of 474 nm, 643 nm and their ratio (474 to 643 nm) with pH values ranging from 3 to 8 [157].

