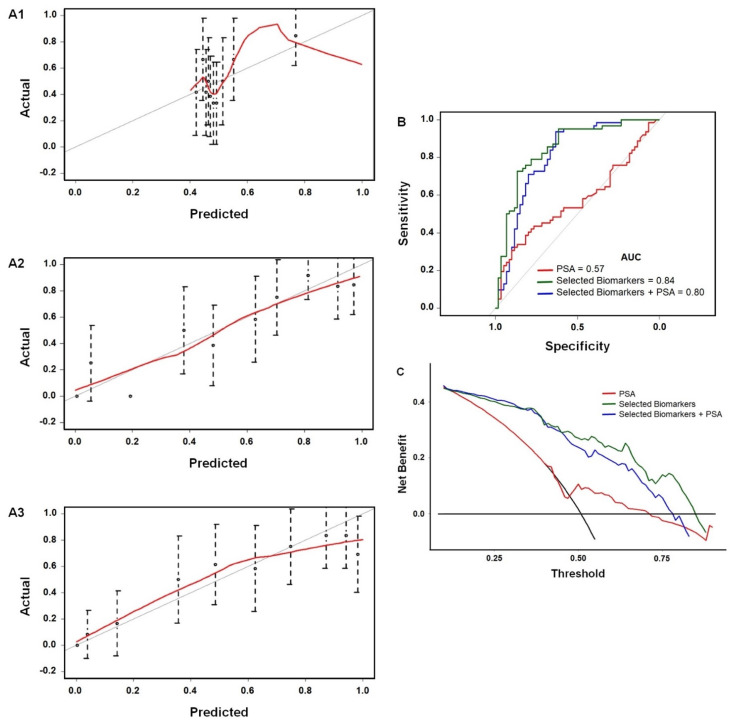
Figure 6.
Calibration plots, ROC, and decision curves for predicting need for biopsy. Calibration plots illustrate predicted probabilities on the x-axis and the actual outcome on the y-axis (A1) PSA alone, (A2) selected biomarkers + PSA, model 2, and (A3) selected biomarkers, model 3. (B) ROC plot and AUC values of the biomarkers at each risk threshold, for the best model PSA + selected biomarkers. sensitivity and specificity are both 79%; (C) decision curves showing the net benefit of treating all patients or treating none vs. threshold probability. Reproduced from [34], copyright American Chemical society, 2021.

