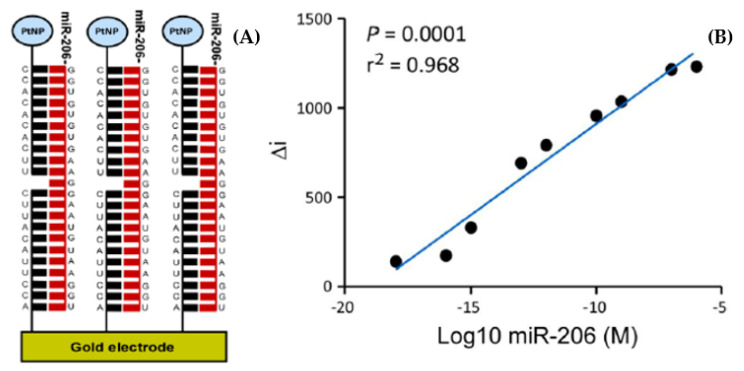
Figure 11.
(A) Schematic representation of the nucleic acid sandwich assay using electrocatalytic nanoparticles as labels on the probe strand. (B) Calibration curve for difference in current (Δi) before and after injection of hydrogen peroxide against known concentration of miR-206 oligonucleotides (linear between 100 nM and 100 aM). Reproduced with permission from [79].

