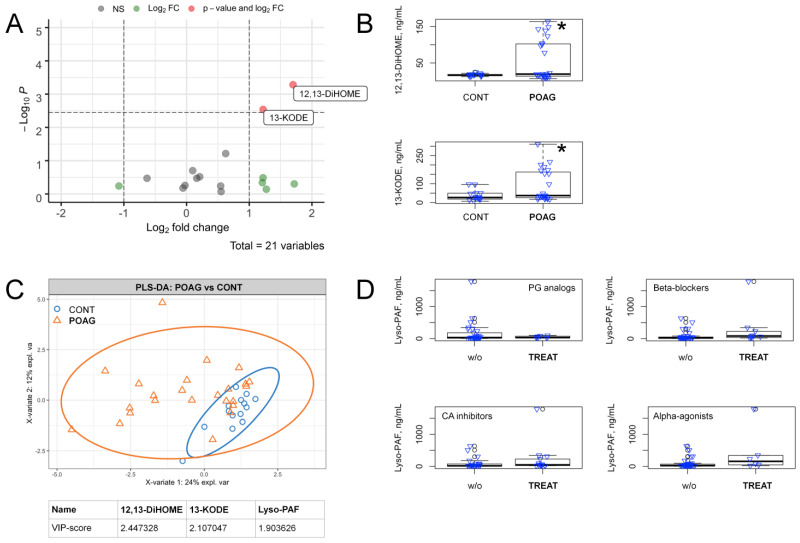
Figure 1.
Alterations in the content of signaling lipids in AH in the total cohort of POAG patients. (A) volcano plot presents compounds discriminating the total POAG and control groups. The X-axis indicates a log2 fold change of age and gender-adjusted concentrations of the identified compounds in POAG patients as compared to the control individuals. The Y-axis indicates -log10 p-values with the cut-off calculated according to Bonferroni correction. Compounds that changed less than twofold (Log2 FC) or demonstrated non-significant (NS) alterations (p > 0.05) are indicated in green and gray colors, respectively. The significantly changed compounds (p < 0.05) are denoted in red color (value and Log2 FC). (B) the box plots demonstrating concentrations of metabolites exhibiting significant changes in glaucoma patients (POAG) as compared with control individuals (CONT). * p < 0.05 (adjusted for multiple testing). (C) the results of partial least square discriminant analysis (PLS-DA) revealing compounds distinguishing total glaucoma patients (POAG) from the control individuals (CONT). The explained variance of each component is indicated on the axes. Variable importance in projection (VIP) scores exceeding a cutoff value of 1.5 are considered. (D) the box plots illustrating pairwise comparisons of lyso-PAF concentrations in AH of POAG patients with (TREAT) or without (w/o) anti-glaucoma treatment using prostaglandins (PG) analogs, beta-blockers, carbonic anhydrase (CA) inhibitors or alpha-adrenergic agonists. In all cases p > 0.05.

