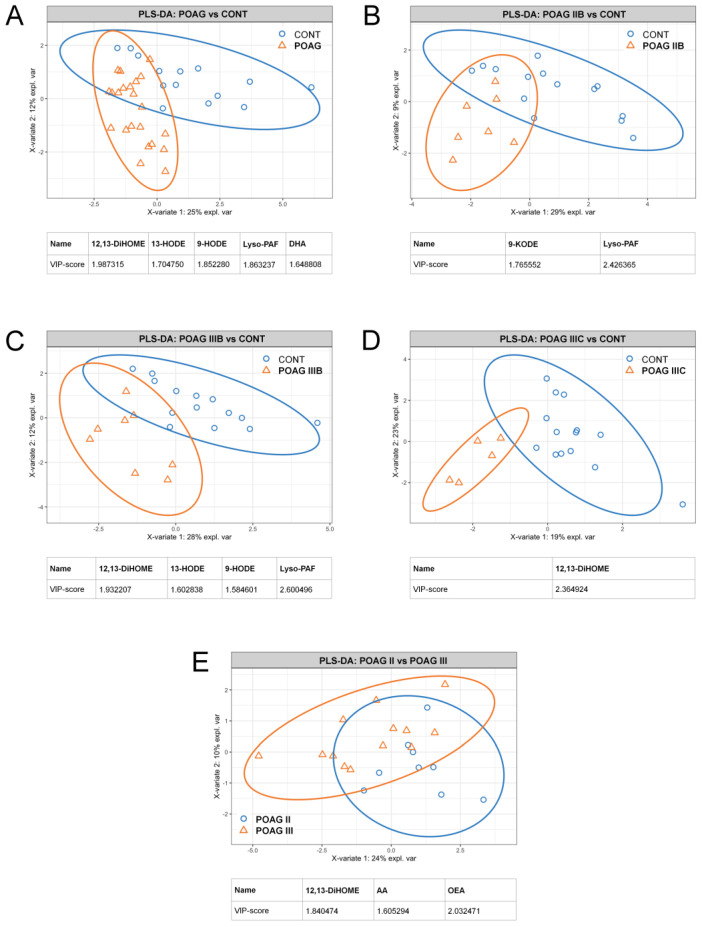
Figure 3.
Total and stage/IOP-dependent alterations in the content of signaling lipids in TF of POAG patients. The results of partial least square discriminant analysis (PLS-DA) revealing TF compounds distinguishing total glaucoma patients (A) and patients with Stage IIB (B), Stage IIIB (C) or Stage IIIC (D) POAG from the control individuals (CONT). The PLS-DA data regarding comparison of TF contents of signaling lipids patients with different POAG stages regardless IOP levels are also presented (E). The explained variance of each component is indicated on the axes. Variable importance in projection (VIP) scores exceeding a cutoff value of 1.5 are considered.

