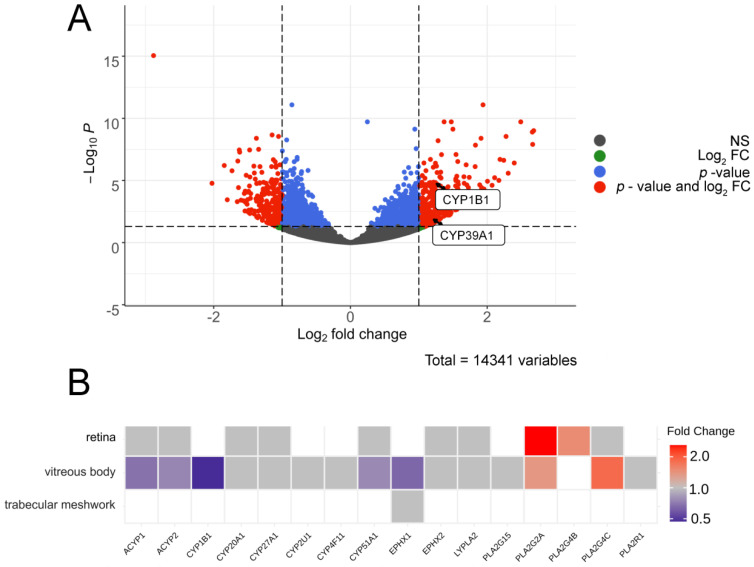
Figure 4.
Bioinformatic analysis of enzymatic pathways responsible for production of the revealed POAG-specific lipid mediators in AH. (A) volcano plot indicating DEGs corresponding to signaling lipids-synthesizing enzymes in TM cells underwent long-term perfusion at high pressure according to analysis of the transcriptomic data 37. The X-axis indicates a log2 fold change in levels of transcripts in TM cells perfused at high pressure for 3 h as compared to 5 h. The Y-axis indicates -log10 p-values with the cut-off calculated according to Bonferroni correction. mRNAs that changed less than twofold (Log2 FC) or demonstrated non-significant (NS) alterations (p > 0.05) are indicated in green and gray colors, respectively. The significantly changed transcripts (p < 0.05) are denoted in red color (value and Log2 FC). (B) a clustered image map illustrating changes in expression of signaling lipids-synthesizing enzymes in the retina, vitreous body and trabecular meshwork of POAG patients determined from analysis of proteomic data. The map is built using the Euclidean distance and complete linkage clustering algorithm. Each entry is colored according to its fold change, rows represent tissues, and columns represent enzymes. Abbreviations: ACYP: acylphosphatase-2; CYP1B1: cytochrome P450 1B1, CYP20A1: cytochrome P450 20A1; CYP27A1: cytochrome P450 27A1; CYP2U1: cytochrome P450 2U1; CYP4F11: cytochrome P450 4F11; CYP51A1: cytochrome P450 51A1; EPHX1: epoxide hydrolase 1; EPHX2: epoxide hydrolase 2; LYPLA2: acyl-protein thioesterase 2; PLA2G15: phospholipase A2 G15; PLA2G4B: phospholipase A2 G4B; PLA2G4C: phospholipase A2 G4C; PLA2R1: phospholipase A2 R1.

