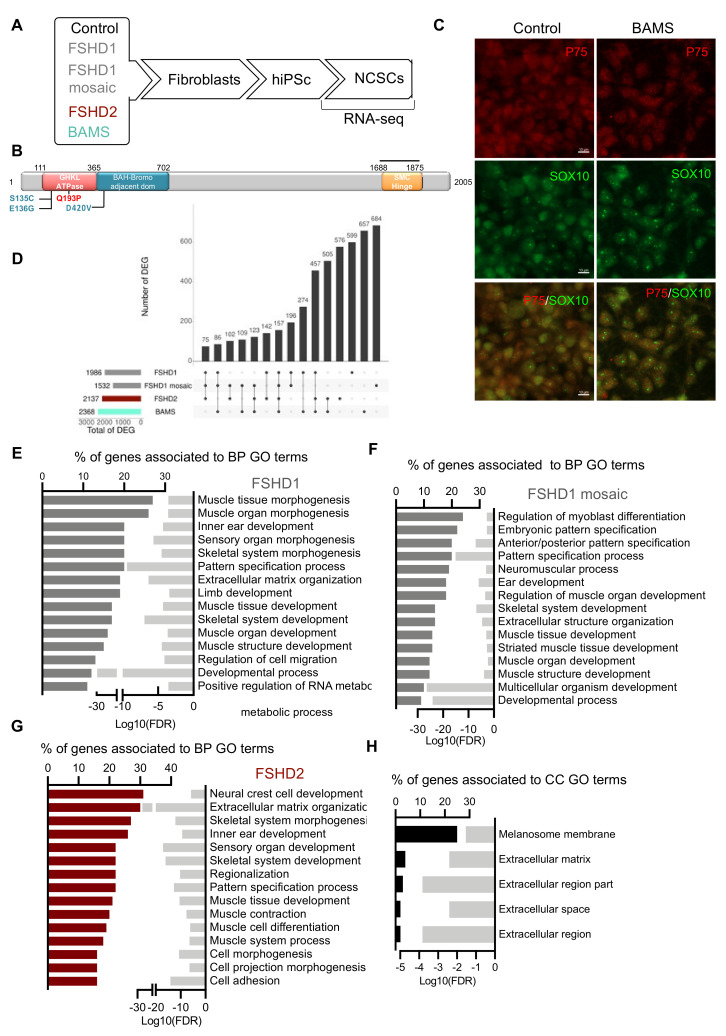
Figure 1.
Gene expression profiling in Facio-Scapulo-Humeral Dystrophy (FSHD) patients’ neural crest stem cells. (A) Schematic overview of the samples used and steps of analysis. Induced pluripotent stem cells (hiPSCs) were derived from primary fibroblasts from healthy donors (controls), patients affected with type 1 FSHD (one FSHD1 patient carrying 7 D4Z4 repeated units (#12759) and one patient with mosaicism (25% of the cells carry a 4qA allele with 2 D4Z4 repeated units; 75% of cells carry a 4qA allele with 15 D4Z4 repeated units (#17706)), FSHD2 (#14586; c.573A > C; p.Q193P) or Bosma Arrhinia and Microphthalmia Syndrome (BAMS) (BAMS-1; c.407A > G; p.E136G) (Supplementary Table S1). Fibroblasts were reprogrammed into human induced pluripotent stem cells (hiPSCs). For FSHD1 mosaic cells, hiPSC clones carrying the contracted D4Z4 or the isogenic non-pathogenic D4Z4 allele were isolated separately. Cells were described in [9]. All hiPSC clones were differentiated into Neural Crest Stem Cells (NCSCs) as described [15]. Gene expression analysis was performed by high throughput RNA-sequencing at day 10 of differentiation; (B) Schematic representation of the SMCHD1 (Structural Maintenance of Chromosome flexible Hinge Domain containing 1) protein and position of mutations in BAMS (cyan) or FSHD2 patient (red). BAMS-1 carries a missense mutation in the ATPase domain reported as a gain-of-function (E136G). FSHD2 patient #14586 carries a mutation in the ATPase domain reported as a loss-of-function of the ATPase activity (Q193P); (C) Immunostaining of NCSCs stained with antibodies against p75NTR (green) and SOX10 (red) at day 10 post-differentiation; (D) Upset plot for comparison of Differentially Expressed Genes (DEGs) with fold change >2 or <−2 and a p-value < 0.05 in FSHD1, FSHD1 mosaic, FSHD2 and BAMS NCSCs; (E–H) Gene Ontology (GO) terms for biological pathways (BPs) corresponding to enrichment analysis of unique DEGs. The bars on the left represent the percentage of DEGs determined for each condition from the total number of DEGs. Light gray bars on the right represent the enrichment score (Log10 of False Discovery Rate) for each GO term. (E) FSHD1 vs. control NCSCs (dark gray bars); (F) FSHD1 mosaic (dark gray bars) vs. isogenic control NCSCs; (G) FSHD2 vs. control NCSCs. (dark red bar plot); (H) GO terms associated with Cellular Component (CC) analysis for DEGs common to FSHD1, FSHD1 mosaic, and FSHD2 NCSCs.

