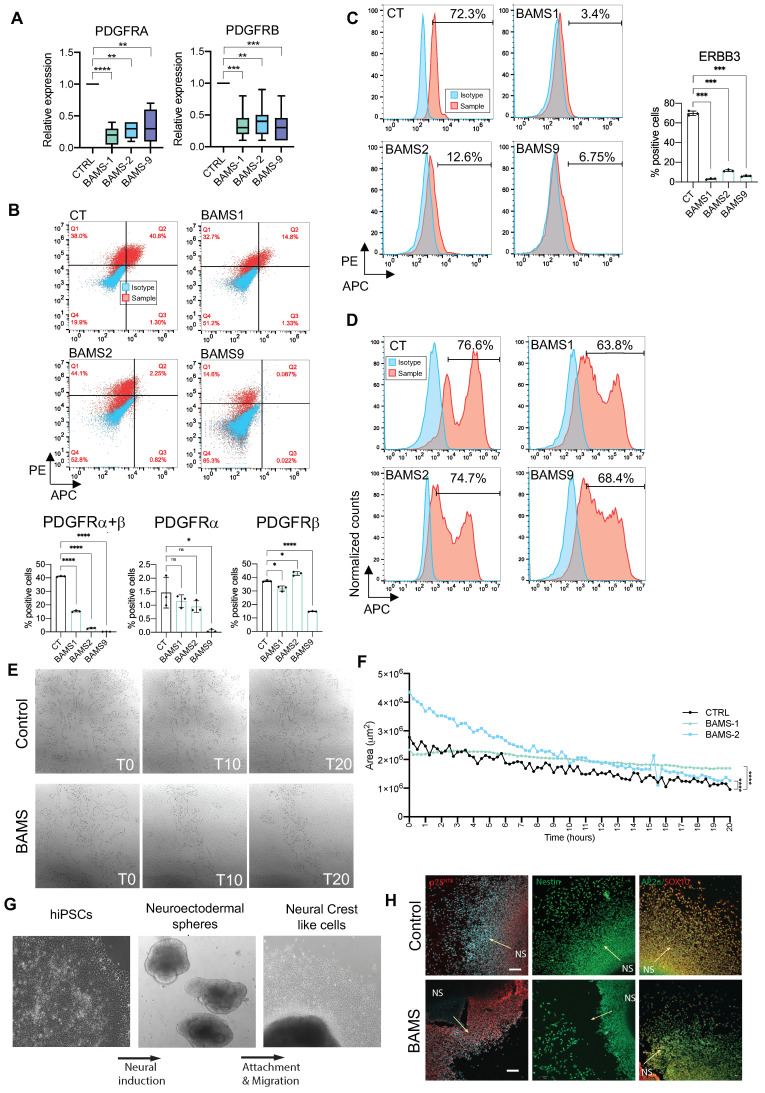
Figure 5.
Functional analysis highlights delayed migration in BAMS patients’ cells. (A) Expression of PDGFRα (Platelet Derived Growth Factor Receptor Alpha) and β (Platelet Derived Growth Factor Receptor Alpha Beta) by RT-qPCR in BAMS and control NCSCs. Statistical significance was determined using a Kruskal–Wallis statistical test. ** p-value < 0.005, *** p-value < 0.0005, and **** p-value < 0.00005; (B–D) Quantification by flow cytometry performed in triplicate for each sample. Statistical significance was determined using Brown–Forsythe and Welch ANOVA tests: * p-value < 0.05, **** p-value < 0.00005, ns: non-significant. (B) Quantification of PDGFRα- and PDGFRβ-positive cells by flow cytometry analysis. APC fluorescence corresponding to PDGFRα is plotted on the x-axis and PE fluorescence corresponding to PDGFRβ on the y-axis. Fluorescence corresponding to the isotypes, blue dots; samples, red dots. Histograms display the average values and standard deviations for the different biological and technical replicates; (C) Quantification of ERBB3-positive NCSCs by flow cytometry analysis. APC fluorescence corresponding to the isotype (blue curve) or ERBB3 antibody (red curve) is plotted on the x-axis and normalized counts on the y-axis. Histograms display the average values and standard deviations for the different biological and technical replicates; (D) Quantification of Ki67-positive NCSCs by flow cytometry analysis. APC fluorescence corresponding to the isotype (blue curve) or Ki67 antibody (red curve) is plotted on the x-axis and normalized counts on the y-axis. The percentage of Ki67-positve cells is indicated for each sample; (E) Representative images of wound closure by migration tested using a scratch assay to determine the rate of migration of NCSCs derived from control (upper panel) or BAMS (lower panel) hiPSCs. Experiments were performed in triplicate from two different differentiation experiments and recording was done by live imaging for 25 h. Several areas (delimited automatically, black lines) were simultaneously analyzed per well. Snapshots correspond to the time at which the scratch was made (T0), after 10 h (T10) and 20 h (T20); (F) Quantification of wound closure from the initial scratch in the different conditions. Gap areas were measured in square micrometers (y-axis) as a function of time (x-axis). Statistical significance was determined using a Friedman non-parametric test for comparison of paired area values between conditions. ****, p-value < 0.00005; (G) Representative images of human iPSC differentiation into neural crest-like cells through neuroectodermal spheres using protocol adapted from [16]; (H) BAMS neural crest generated through neuroectodermal spheres show migration defects. Immunocytochemistry of neural crest markers in control and BAMS neural crest-like cells. BAMS cells show numerous gaps between neuroepithelial spheres (marked by NS) and the emerging neural crest-like cells. Arrows show the direction of neural crest migration from neuroepithelial spheres. Scale bar = 100 μm.

