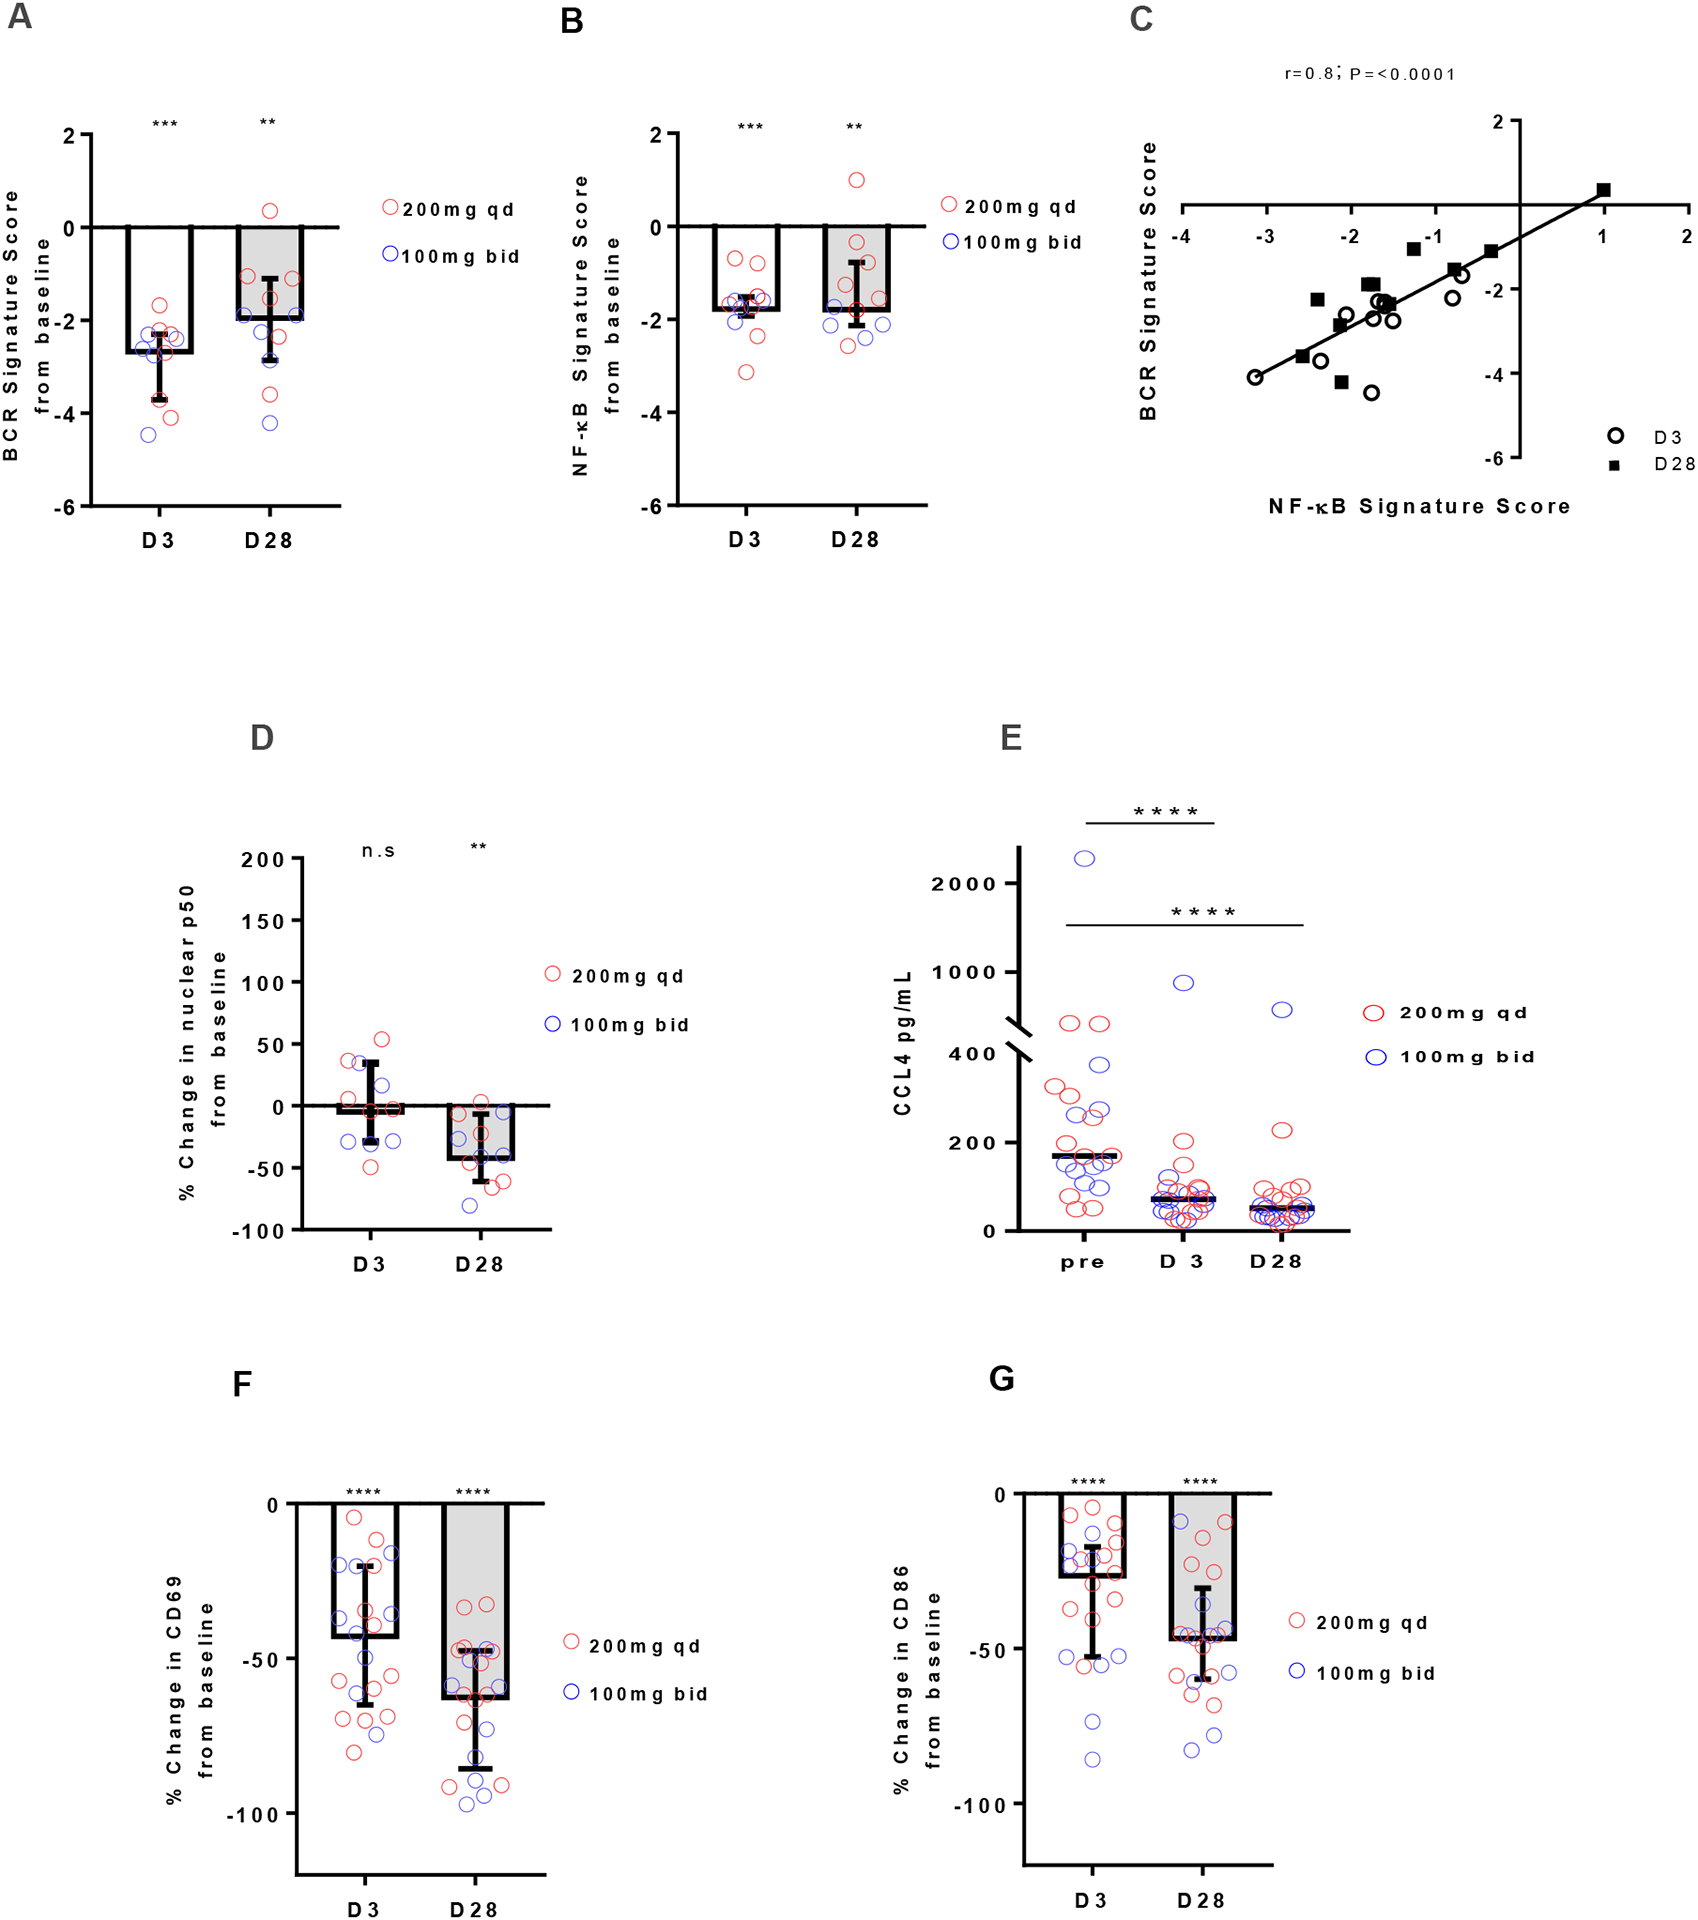
Figure 2: Inhibition of downstream effects of BCR activation by acalabrutinib.

A-B, Change in gene signature score in CD19+ selected CLL cells collected on day 3 (D3) and day 28 (D28) normalized to pre-treatment (n=11). Red circles represent 200mg qd dosing (n=6); blue circles represent 100mg bid dosing (n=5). Bars represent median (±IQR). (A) BCR signature score. (B) NF-κB signature score. C, Pearson correlation between change in BCR and NF-κB signature scores. Each dot represents one patient, circles represents day 3, squares represent day28. R and P values of Pearson correlation are displayed. D, Nuclear expression of NF-κB p50 in CD19+ selected CLL cells by ELISA (n=11). E, CCL4 serum levels measured by Luminex Assays at baseline (Pre), day 3, and day 28 (n=22). F-G Median (±IQR) percent change in MFI measured by flow cytometry (n=21) at day 3 and day 28 compared to baseline for (F) CD69; (G) CD86. Statistical significance by Wilcoxon matched-pairs signed-rank test between baseline and treatment timepoints is indicated: **P<0.01, ***P<0.001 and ****P<0.0001.
