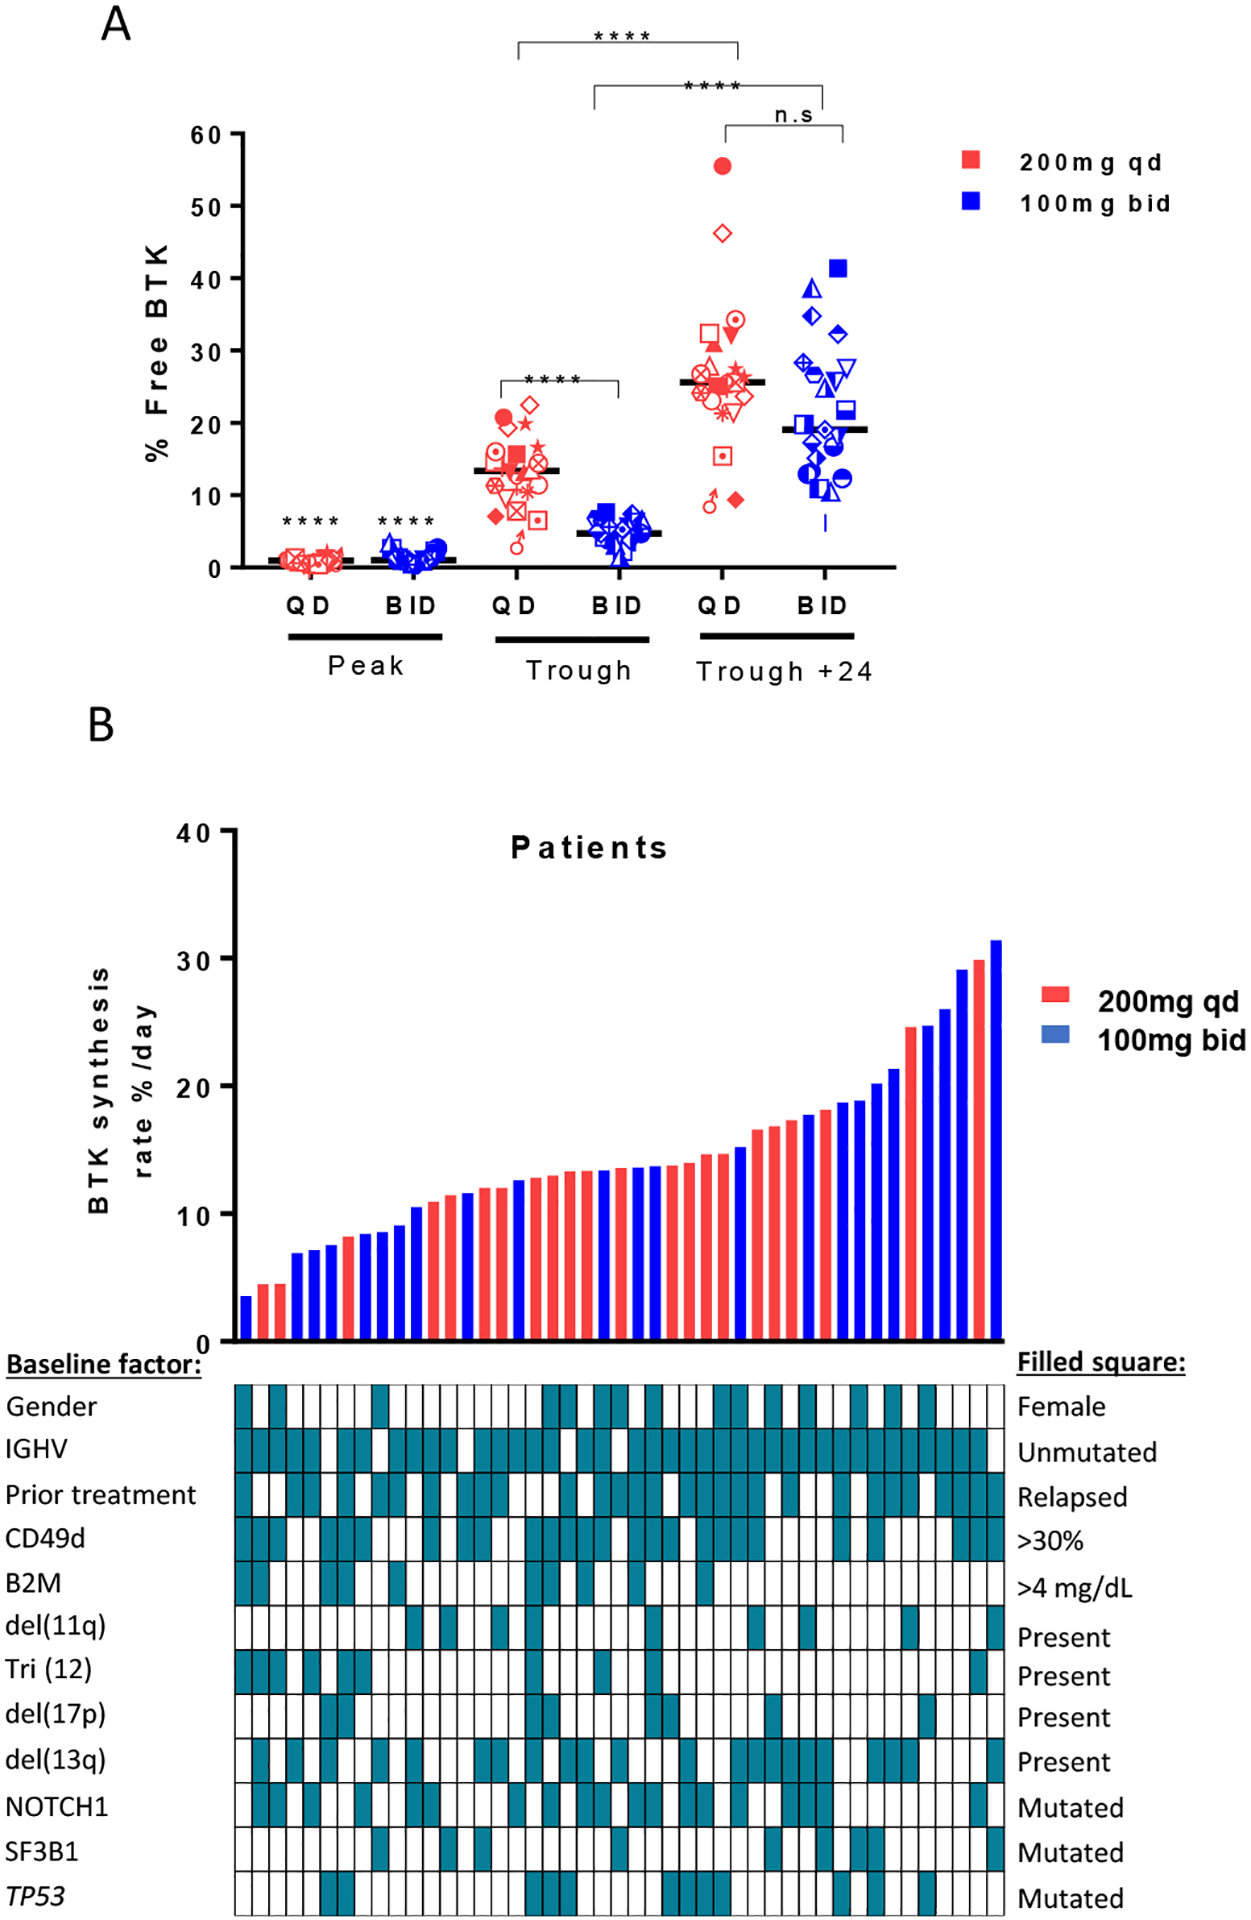
Figure 3: Interpatient variability in BTK synthesis rates.

A, percent free BTK on day 3 (Peak), day 4 (Trough) and day 5 (Trough + 24 hours). Black line represents the median. Each symbol represents one patient. Red symbols represent qd dosing; blue symbols represent bid dosing. B, Rate of change in percent free BTK per day for all evaluated patients aligned with different baseline factors; red bars represent 200mg qd patients; blue bars represent 100mg bid patients. Range 3.5 – 31.4%. Linear regression was used to calculate slopes for the return of free BTK and to determine the BTK synthesis rate per day. Statistical significance by Wilcoxon matched-pairs signed-rank test between baseline and treatment timepoints, and Wilcoxon rank-sum test between dose groups is indicated: ****P<0.0001.
