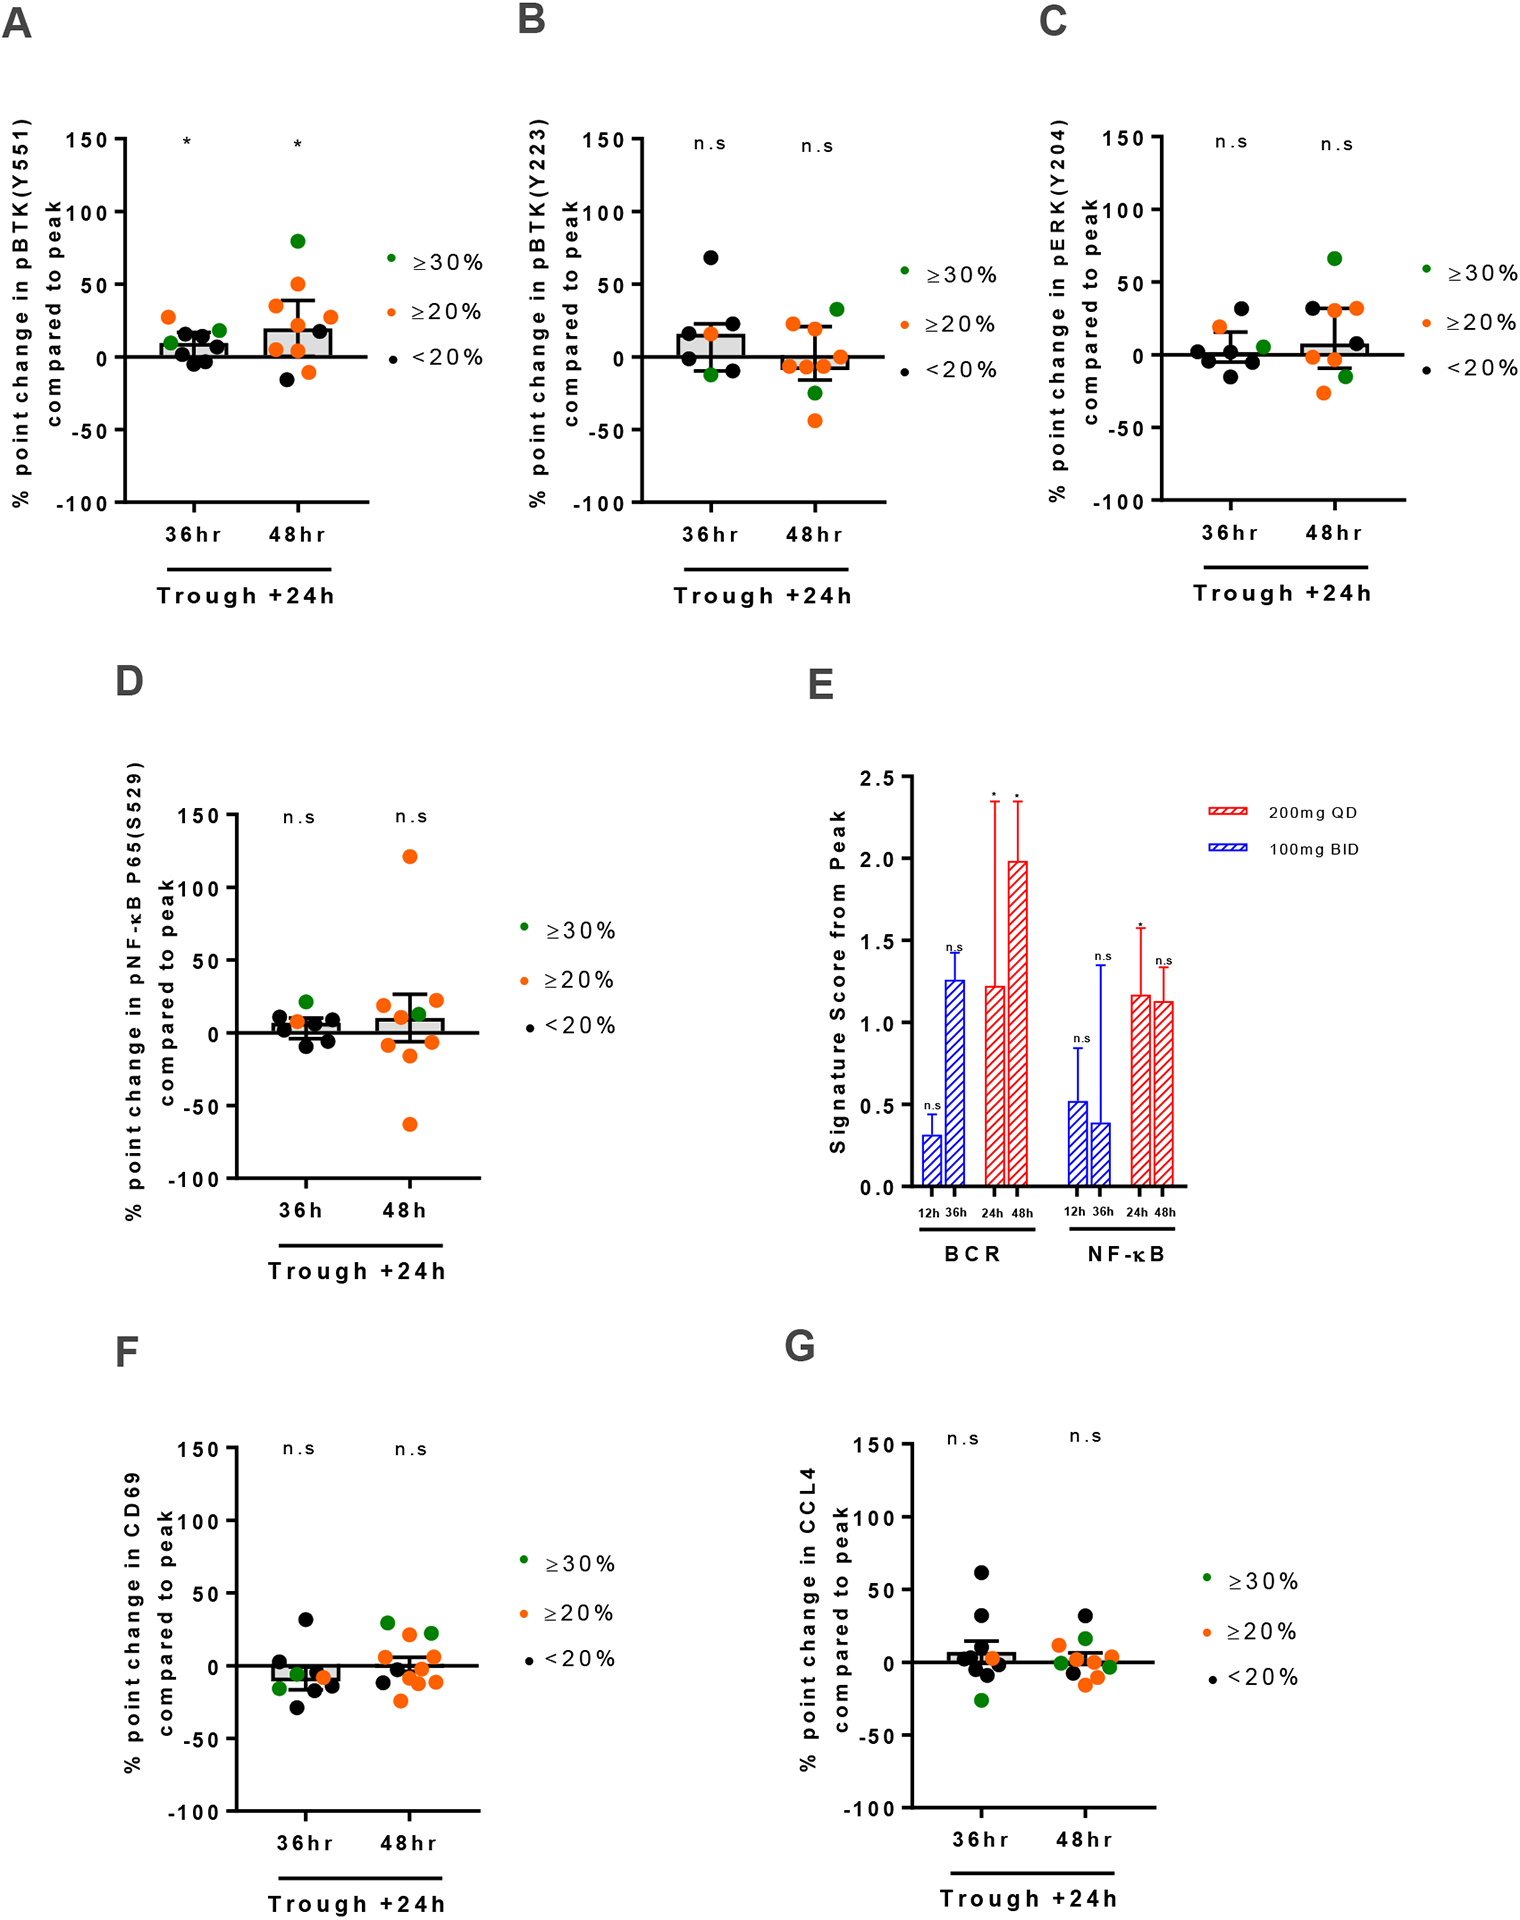
Figure 4: On-target effects up to 48 hours from last dose.

A-D, Levels of phosphorylated signaling molecules measured by flow cytometry at 36 and 48 hours from the last dose of acalabrutinib therapy are displayed as % point change from peak. (A) pBTKY551, (B) pBTKY223 (C) pERKT202/Y204 and (D) pNF-κB p65S529. Only subjects with a significant reduction at peak were included here; Box and Whisker plots display median (±IQR) for all patients analyzed. E, Change in gene signature average in CD19+ selected CLL cells collected 12, 24, 36, and 48 hours from the last dose of acalabrutinib therapy normalized to peak (n=11). Red bars represent 200mg qd dosing (n=6); blue bars represent 100mg bid dosing (n=5). Bars represent median (±IQR). F, Median (±IQR) percent point change in CD69 MFI measured by flow cytometry at 36 and 48 hours from the last dose of acalabrutinib therapy compared to peak (n=21). G, CCL4 serum levels measured by Luminex Assays at 36 and 48 hours from the last dose of acalabrutinib therapy are displayed as % point change from peak (n=22). Green circles represent patients with measured free BTK ≥30%; orange circles represent patients with measured free BTK ≥20% but <30 %; black circles represent patients with measured free BTK <20. Statistical significance by Wilcoxon matched-pairs signed-rank test is indicated: *P<0.05.
