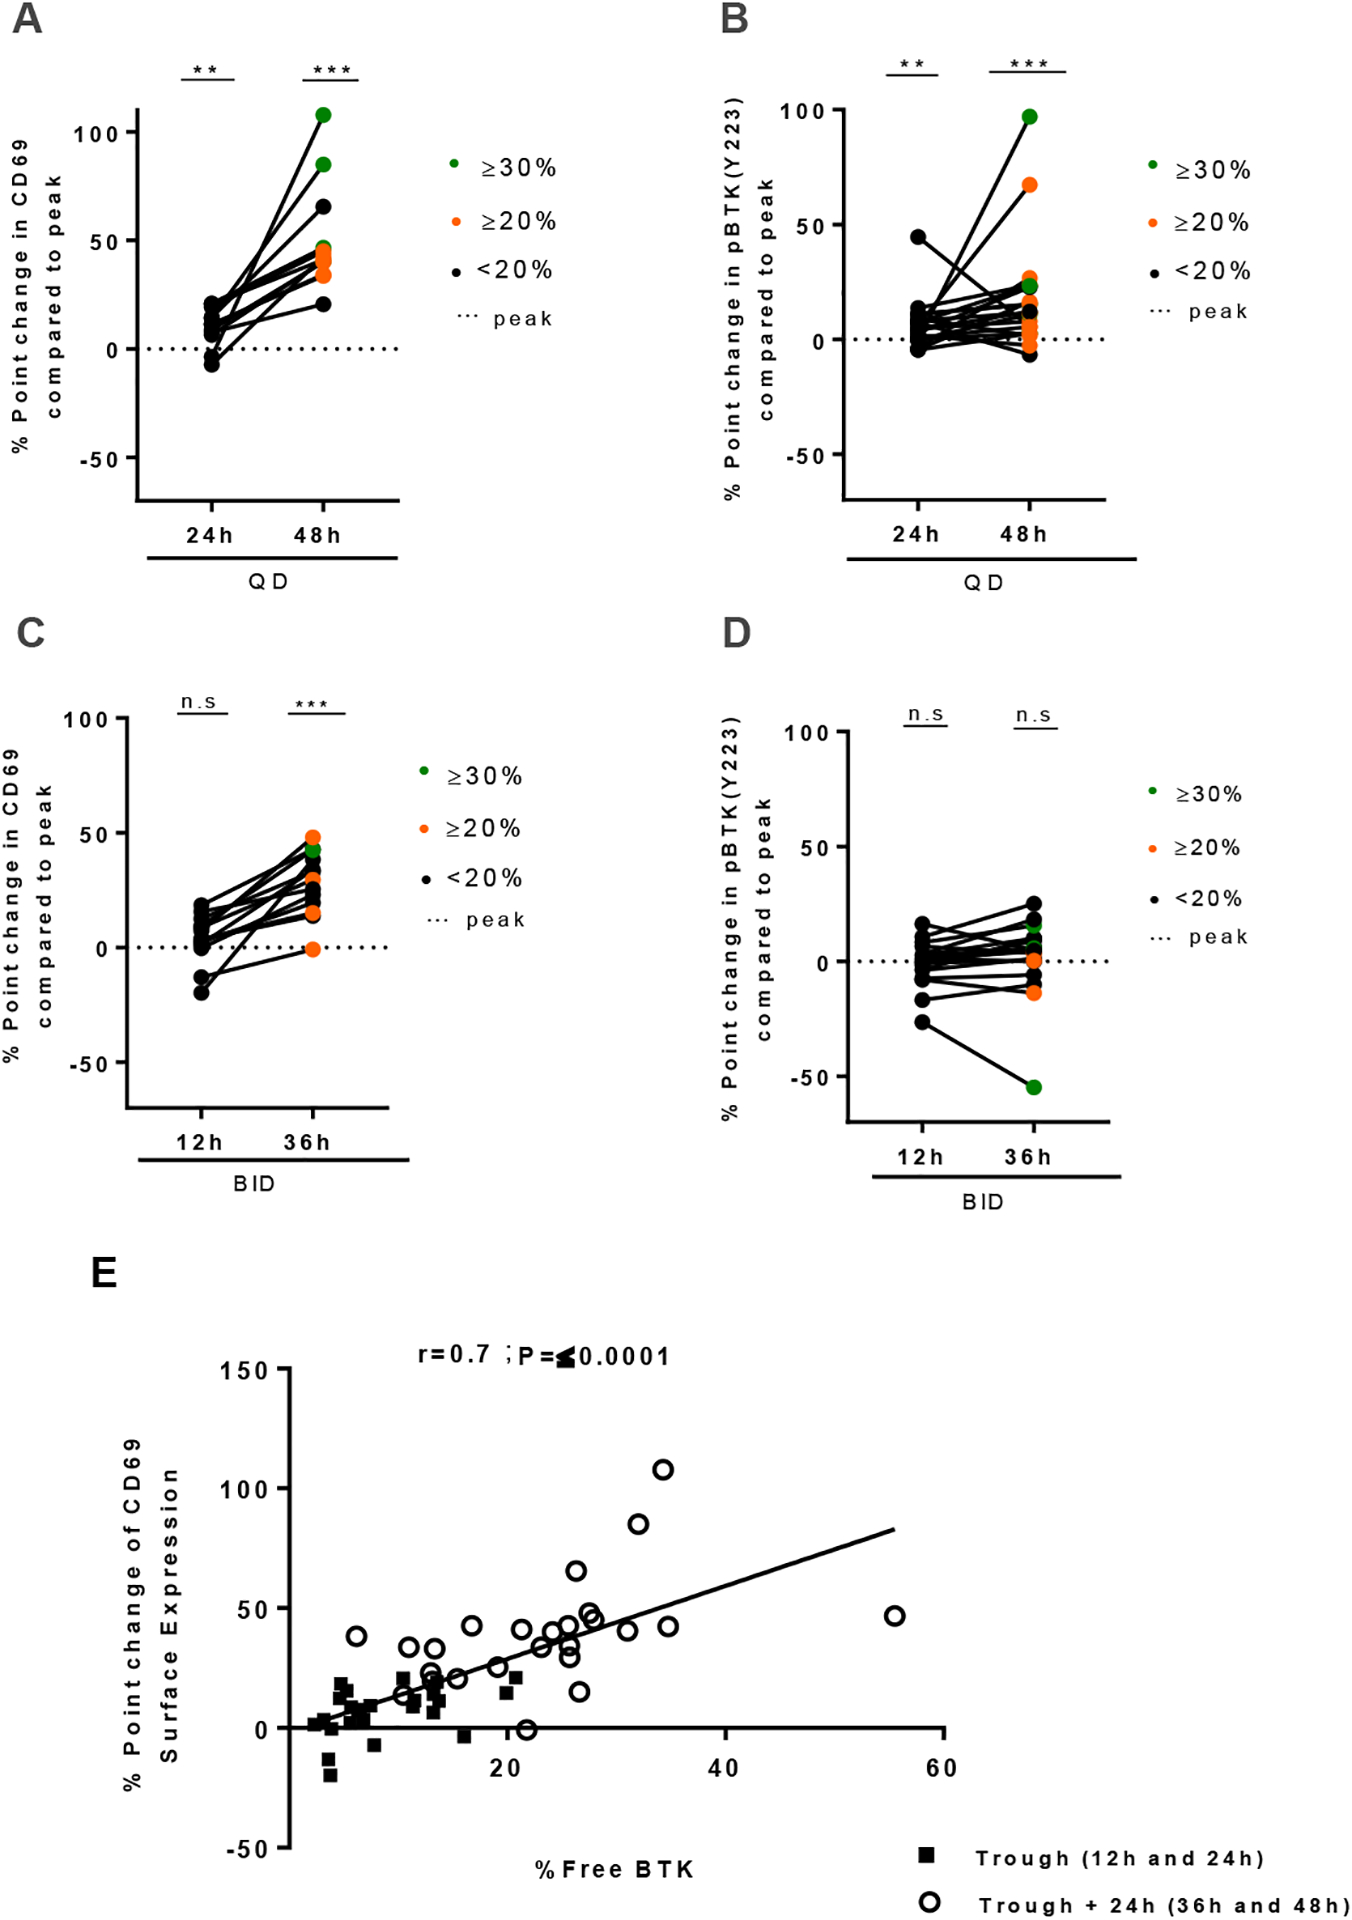
Figure 5: Rebound of BCR signaling occurs in the presence of activation signals and correlates with level of free BTK.

A-B, levels of (A) CD69 expression and (B) pBTKY223 at 24 and 48 hours (qd) from the last dose of acalabrutinib are displayed as % point change from peak. C-D, Levels of (C) CD69 expression and (D) pBTKY223 measured by flow cytometry at 12 and 36 hours (bid) from the last dose of acalabrutinib are displayed as % point change from peak. Statistical significance by Wilcoxon matched-pairs signed-rank test between treatment timepoints is indicated: **P<0.01, ***P<0.001. PBMCs collected at the indicated time points were stimulated with anti-IgM in vitro. Only subjects with day 1 predose ≥ 1.5 fold change over exogenous treatment control (+ 1μM acalabrutinib) were included in the CD69 analysis. In all panels, green circles represent patients with free BTK ≥30%; orange circles represent patients with measured free BTK ≥20% but <30%; black circles represent patients with measured free BTK <20%. E, Pearson correlation of free BTK and % point change in CD69 expression in matched patient samples. Each dot represents one patient, squares represent trough (12h-24h), circles represents trough + 24h (36h-48h).
