
Figure 3.
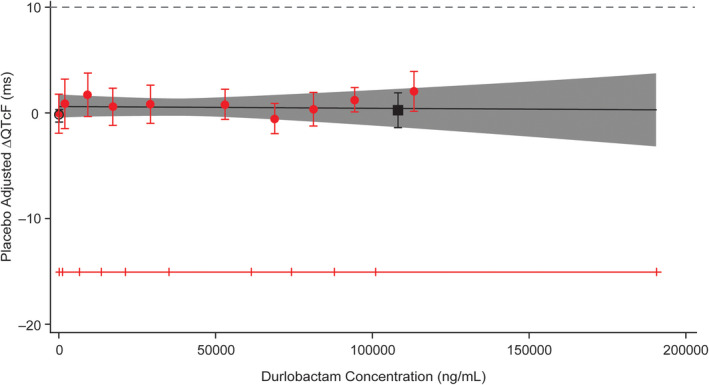
Model‐predicted corrected change from baseline for QTcF (ΔΔQTcF; mean and 90% confidence interval [CI]) and estimated placebo‐adjusted ΔQTcF (mean and 90% CI) across deciles of durlobactam plasma concentrations (top) and predicted ΔΔQTcF interval at geometric mean peak durlobactam concentrations after a 4 g dose (bottom) (pharmacokinetic [PK]/QTc population)