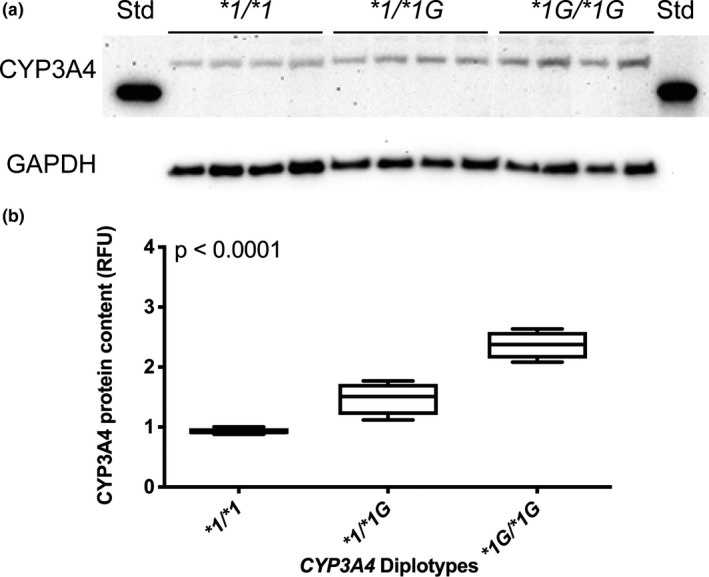
FIGURE 1.

CYP3A4 protein content in lymphoblastoid cell lines (LCLs). Immunoblot of CYP3A4 and glyceraldehyde 3‐phosphate dehydrogenase (GAPDH) in LCLs with CYP3A4*1/*1, *1/*3, and *3/*3 diplotypes (panel a). Quantitation of CYP3A4 normalized to GAPDH endogenous control (panel b). One‐way analysis of variance was used to compare CYP3A4 diplotypes
