
FIGURE 1.
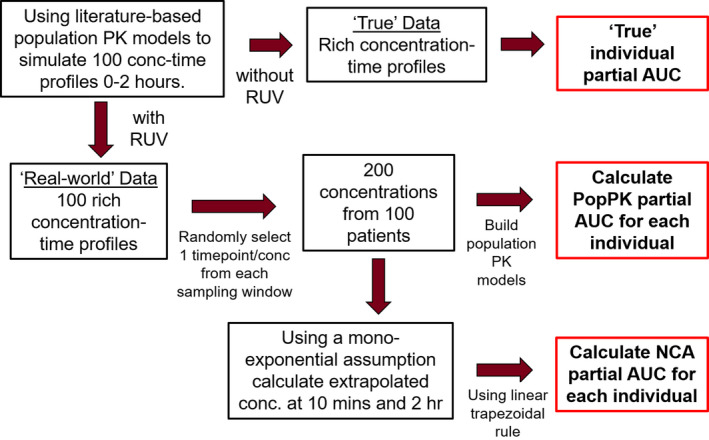
Schematic of the methodology used. AUC, area under the concentration‐time curve from 0 to 2 h after the start of study drug infusion; NCA, non‐compartmental analysis; PK, pharmacokinetic; RUV, residual unexplained variability
Official websites use .gov
A
.gov website belongs to an official
government organization in the United States.
Secure .gov websites use HTTPS
A lock (
) or https:// means you've safely
connected to the .gov website. Share sensitive
information only on official, secure websites.
Schematic of the methodology used. AUC, area under the concentration‐time curve from 0 to 2 h after the start of study drug infusion; NCA, non‐compartmental analysis; PK, pharmacokinetic; RUV, residual unexplained variability