
FIGURE 3.
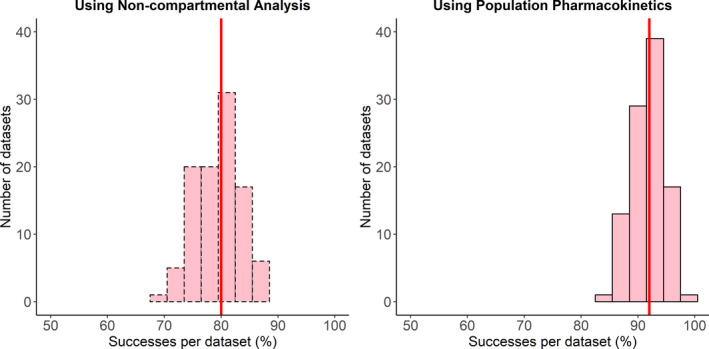
Distribution of percent of successes per dataset for levetiracetam using noncompartmental analysis (left) and population pharmacokinetic analysis (right). The red line indicates the median percent of successes per dataset
Official websites use .gov
A
.gov website belongs to an official
government organization in the United States.
Secure .gov websites use HTTPS
A lock (
) or https:// means you've safely
connected to the .gov website. Share sensitive
information only on official, secure websites.
Distribution of percent of successes per dataset for levetiracetam using noncompartmental analysis (left) and population pharmacokinetic analysis (right). The red line indicates the median percent of successes per dataset