FIGURE 4.

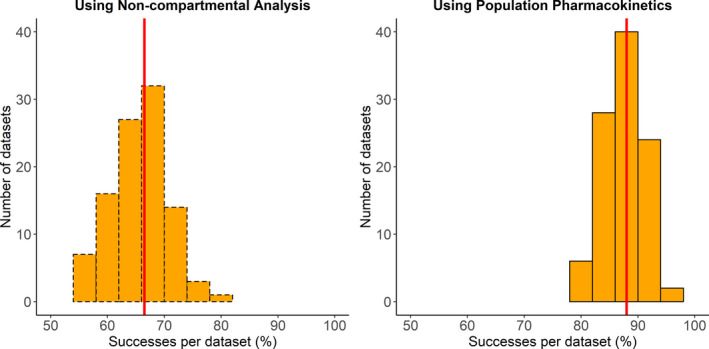
Distribution of percent of successes per dataset for valproic acid using noncompartmental analysis (left) and population pharmacokinetic analysis (right). The red line indicates the median percent of successes per dataset

Distribution of percent of successes per dataset for valproic acid using noncompartmental analysis (left) and population pharmacokinetic analysis (right). The red line indicates the median percent of successes per dataset