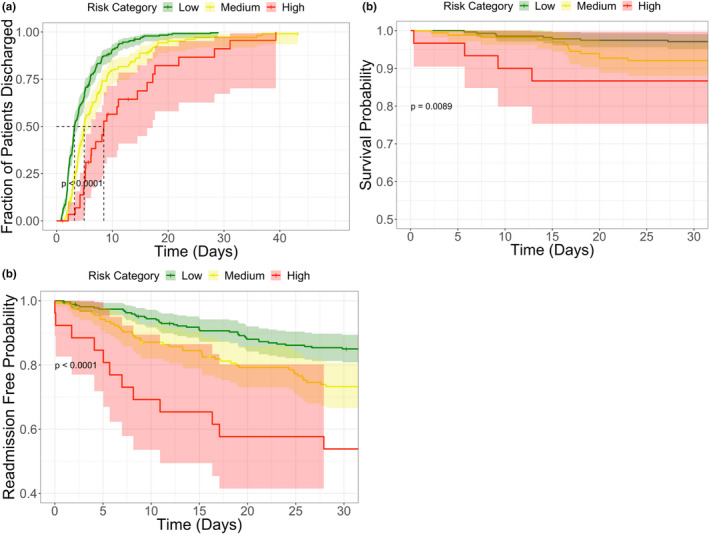
FIGURE 5.

Risk group analysis for three outcomes in the testing cohort: (a) length of hospital stay, (b) 30‐day mortality, (c) 30‐day inpatient readmission. For each risk group and outcome, survival estimates were generated based on the Kaplan‐Meier method, and comparisons of survival distributions were based on the log‐rank test. Statistically significant differences between each of the risk groups are observed for all three outcomes
