
Figure 1.
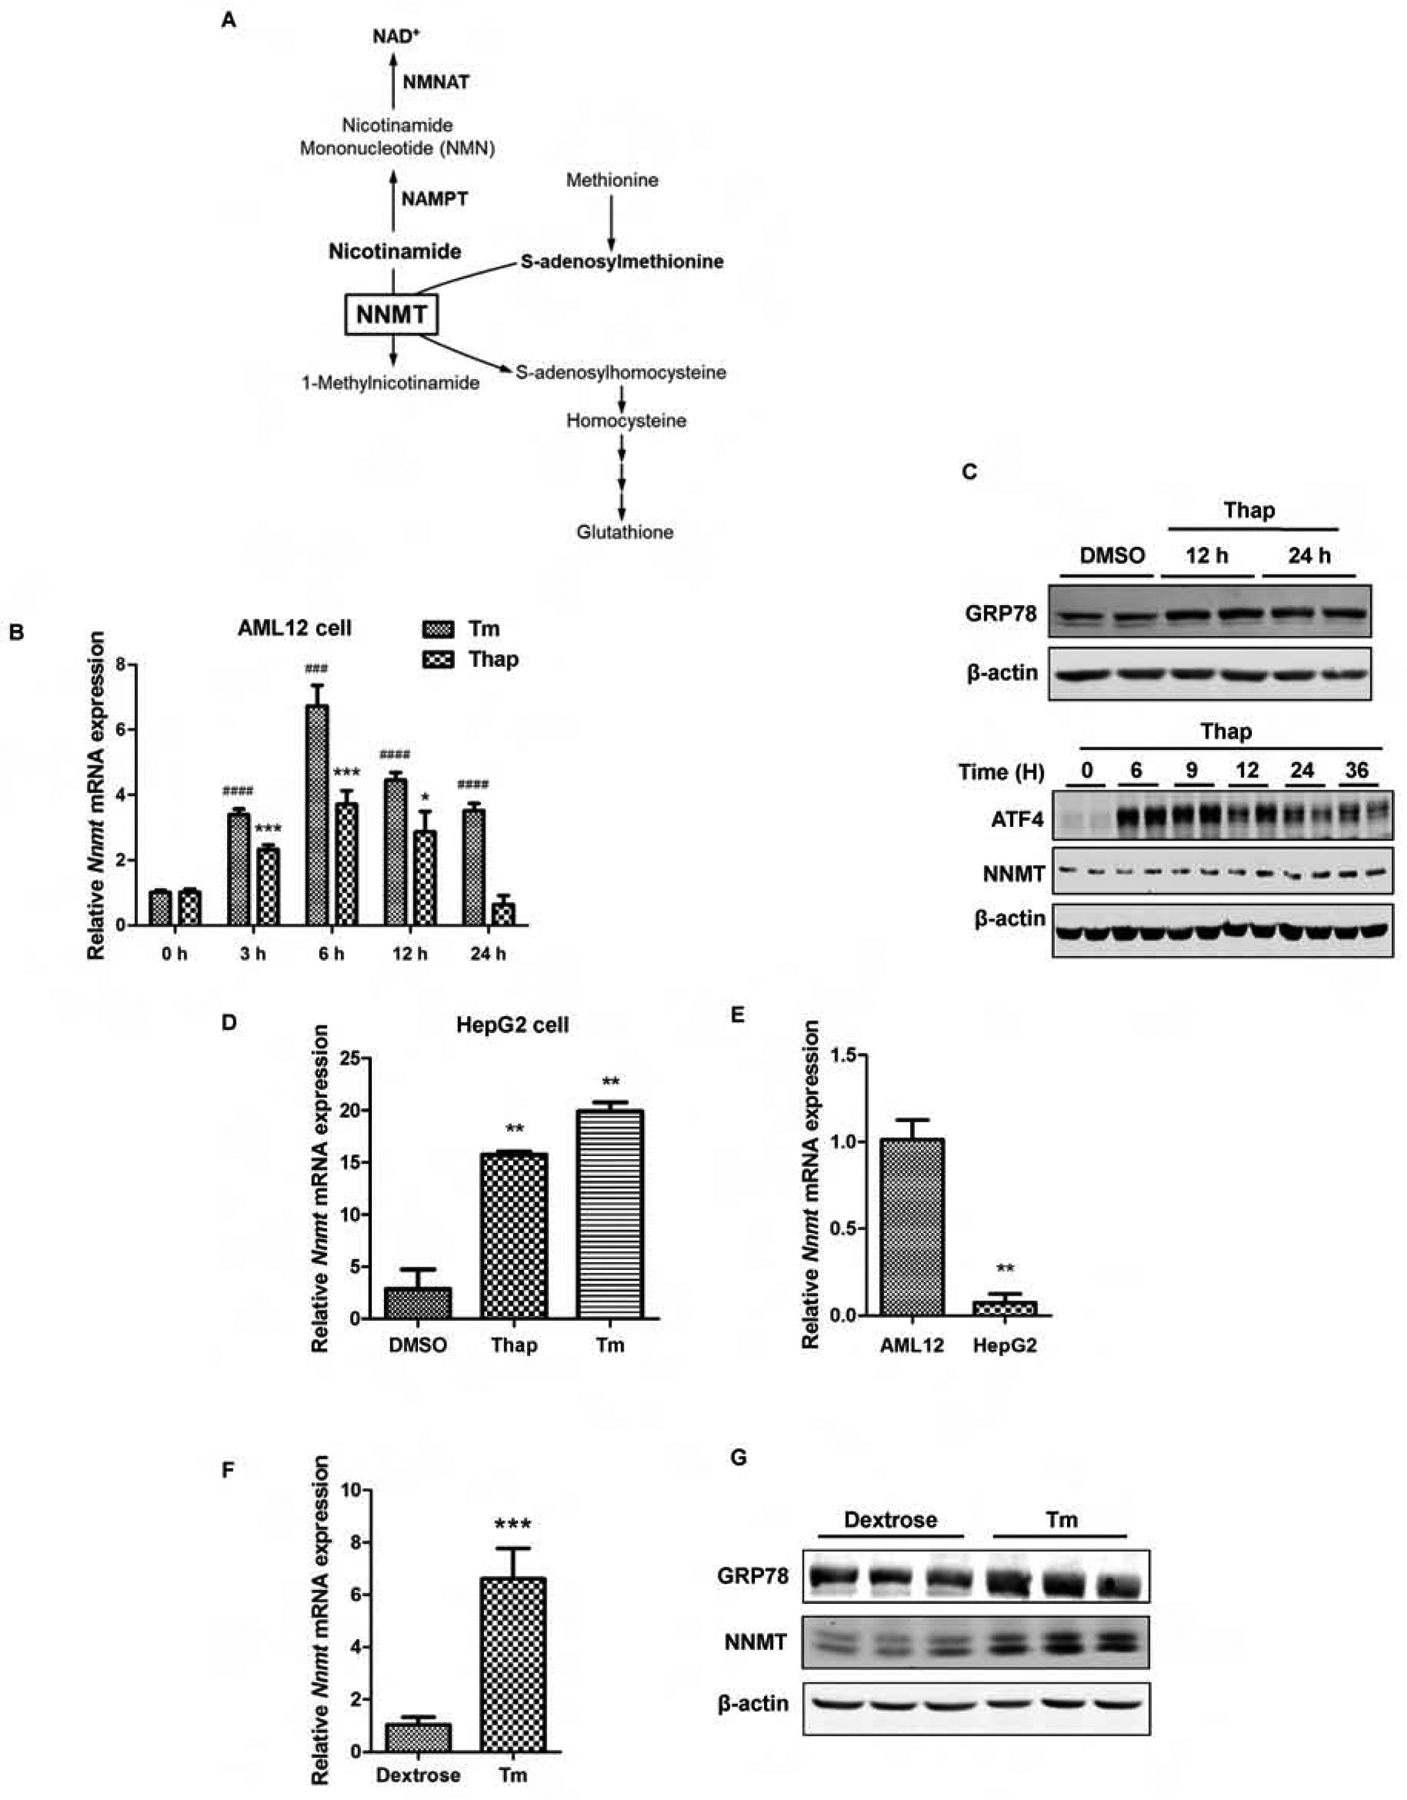
ER stress upregulates NNMT expression. (A) Schematic illustration of simplified NNMT-regulated metabolic pathways. NAMPT: Nicotinamide Phosphoribosyltransferase; NMNAT: nicotinamide mononucleotide adenylyltransferase. (B) Time-course effects of ER stress inducers on NNMT gene expression. AML12 cells were treated with either thapsigargin (Thap, 2 μM) or tunicamycin (Tm, 5 μM) for indicated time periods. NNMT mRNA expression was detected by q-PCR. (C) Time course changes of GRP78, ATF4, and NNMT protein abundance. AML12 hepatocytes were treated with thapsigargin (Thap, 2 μM) for indicated time periods. GRP78, ATF4, and NNMT protein expressions were detected via Western-blotting. (D & E) ER stress upregulates NNMT expression in HepG2 cells. HepG2 cells were treated with either thapsigargin (Thap, 2 μM) or tunicamycin (Tm, 5 μM) for 6 hours and NNMT gene expression measured by q-PCR. (F & G) Tunicamycin administration upregulates NNMT expression at both mRNA and protein level. Ten-week old male C57BL/6N mice were injected with tunicamycin (2 mg/kg BW) or isovolumic vehicle (150 mM dextrose) intraperitoneally. Hepatic NNMT gene expression and protein abundance were determined. Data are expressed as mean ± SEM. Student’s t test was used for statistical evaluation (**p < 0.01, ***, ###p < 0.001, ####p < 0.0001 versus corresponding control).