
Figure 2.
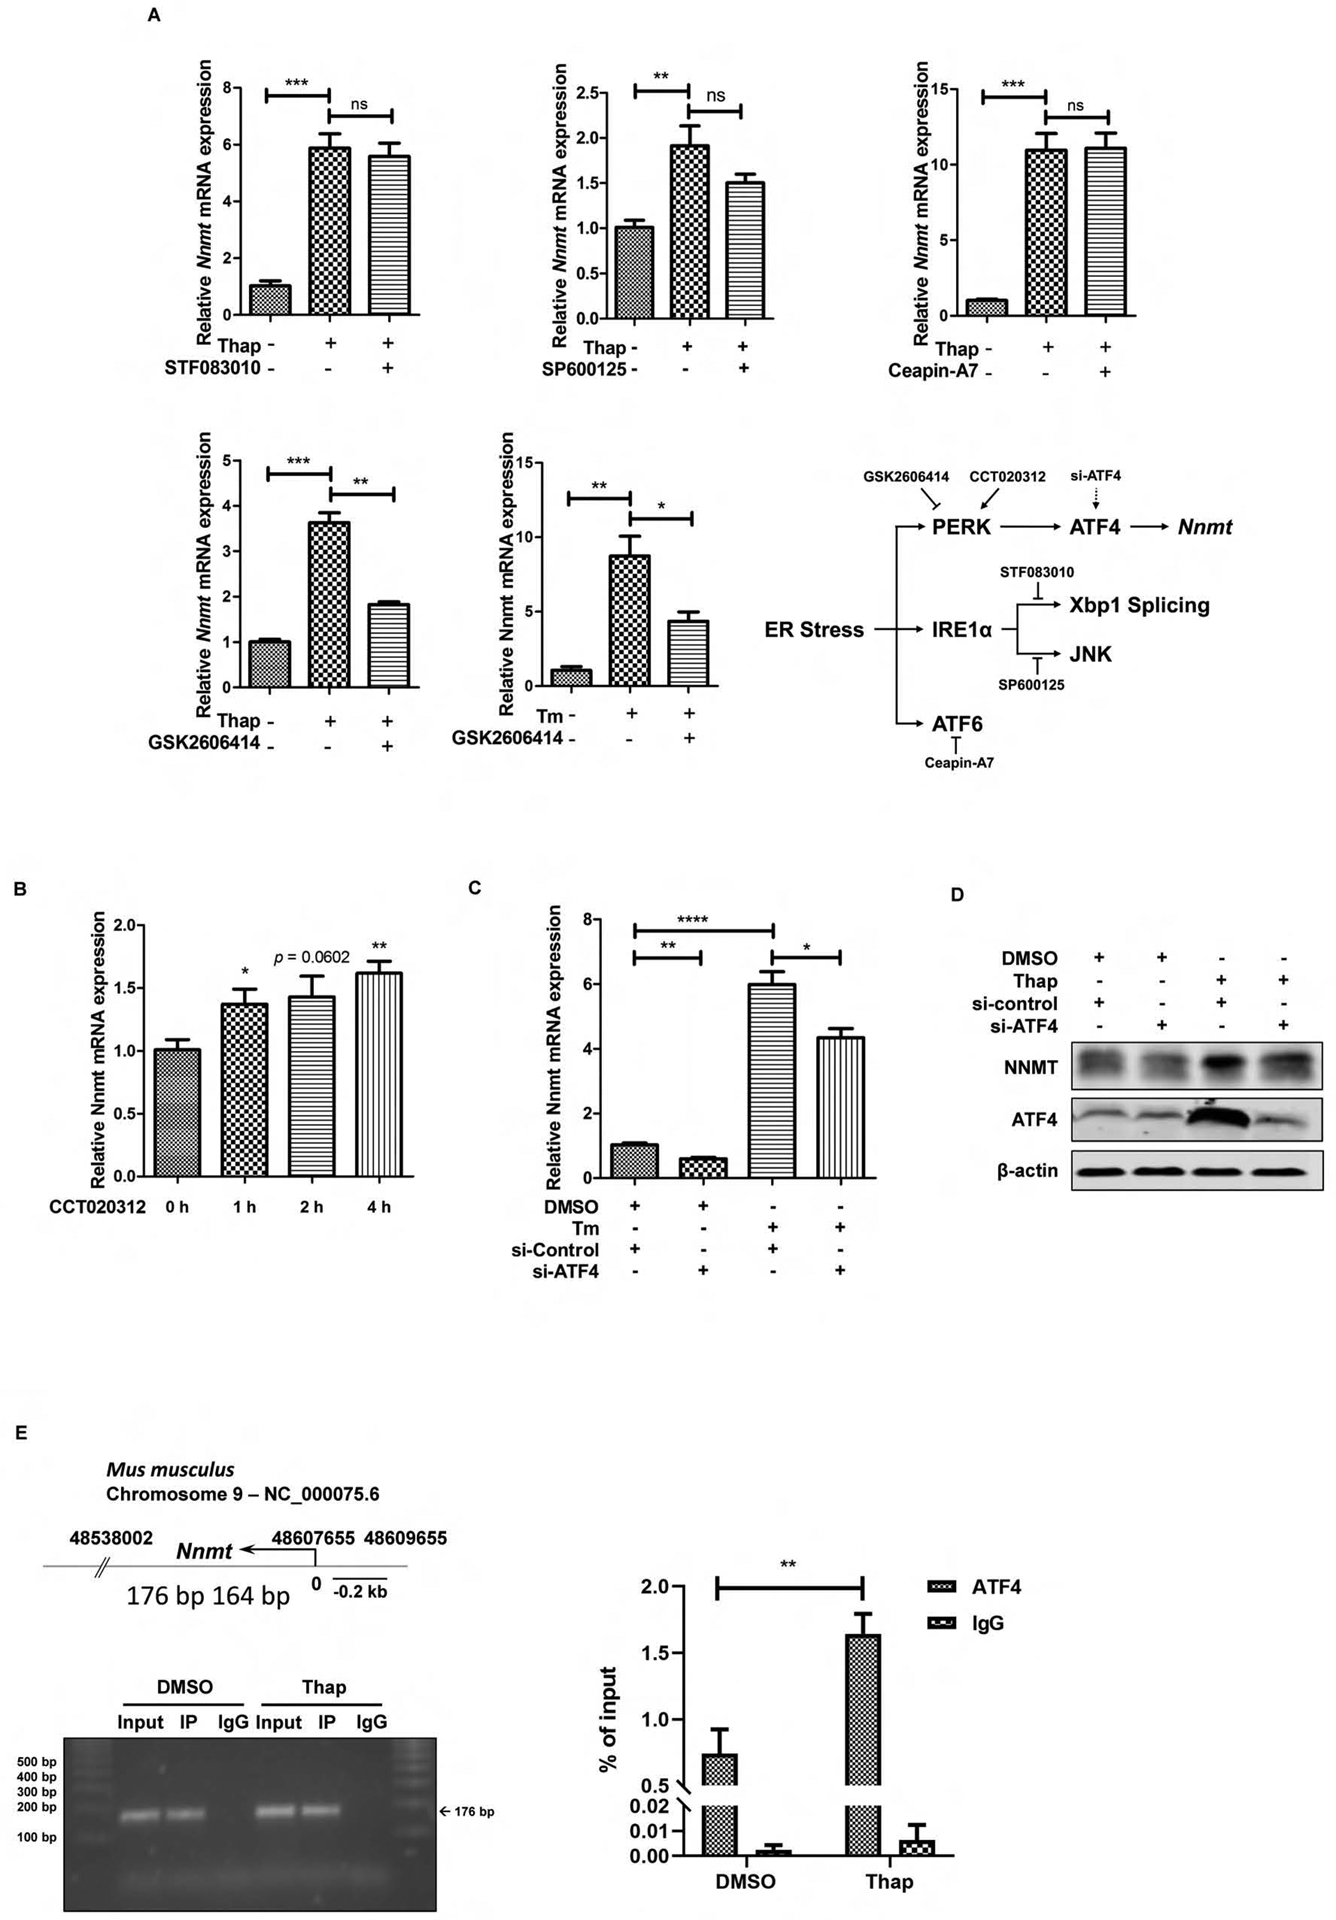
PERK-ATF4 pathway contributes to ER stress-triggered NNMT upregulation. (A) The chemical screening study identifies PERK inhibitor blunts NNMT upregulation upon challenging with ER-stress inducers. AML12 cells were treated with either thapsigargin (Thap, 2 μM) or tunicamycin (Tm, 5 μM) for 6 hours with or without a two-hour pretreatment with IRE1α inhibitor (STF083010 at 40 μM for its endoribonuclease activity and SP600125 at 30 μM for its kinase activity), PERK inhibitor (GSK2606414, 150 nM), or ATF6 inhibitor (Ceapin-A7, 10 μM). NNMT gene expression was detected by q-PCR. (B) Chemical activator of PERK upregulates NNMT gene expression. AML12 cells were treated with PERK activator (CCT020312, 30 μM) for 0–4 h and NNMT gene expression was detected by q-PCR. (C & D) ATF4 siRNA knockdown alleviates ER stress-triggered NNMT upregulation. AML12 cells were transfected with either scrambled siRNA or ATF4 siRNA for overnight, followed by tunicamycin exposure. NNMT mRNA expression and protein abundance were determined at 6 hours. Data are expressed as mean ± SEM, *p < 0.05, **p < 0.01, ***p < 0.001, ****p < 0.0001 versus corresponding control. Differences between 2 groups were determined using Student’s t test. (E) Effect of thapsigargin on ATF4 recruitment to the NNMT promoter. The numbers (176–164bp) indicate nucleotide position of a putative ATF4 binding site within 2000 bp upstream of transcription starting site. AML12 cells were treated with/without thapsigargin (2 μM) for 6 hours and ATF4 recruitment was determined by ChIP assay. The associated DNA was quantified by real-time qPCR with primer pairs specific for the putative ATF4 binding site . Values are normalized by input DNA. Results are expressed as the mean ± SEM fold induction vs basal levels. *p < 0.05, **p < 0.01, ***p < 0.001, ****p < 0.0001 versus corresponding control. Differences between 2 groups were determined using Student’s t test.