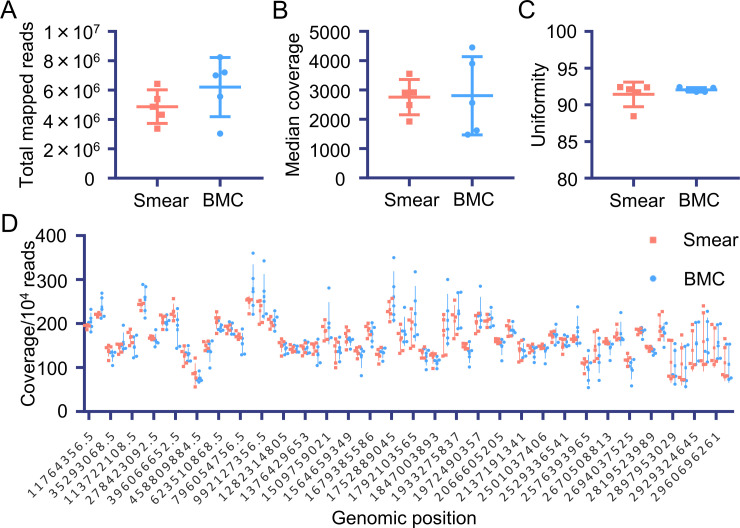
Fig 2. Read and coverage analysis of target sequence data derived from the smear and BMC samples.
The following values were compared between the smear and BMC samples: (A) total mapped reads, (B) median coverage depth, (C) uniformity (more than 20% median coverage), and (D) normalized coverage for each amplicon region.

