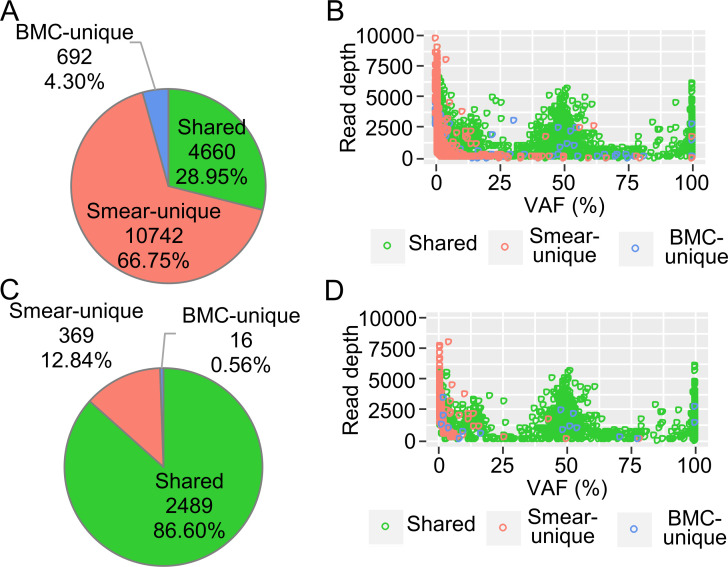
Fig 4. Characteristics of the variants detected using Mutect2 and the filtering effect.
Combined results from five paired samples of smears and bone marrow cells (BMCs) are shown. (A) Pie chart of the smear-unique, BMC-unique, and shared variants. (B) Distribution of the detected variants. VAF, variant allele frequency. The smear-unique, BMC-unique, and shared variants are color-coded. (C) Pie chart of the variants after filtering with FilterMutectCalls. (D) Distribution of the filtered variants.

