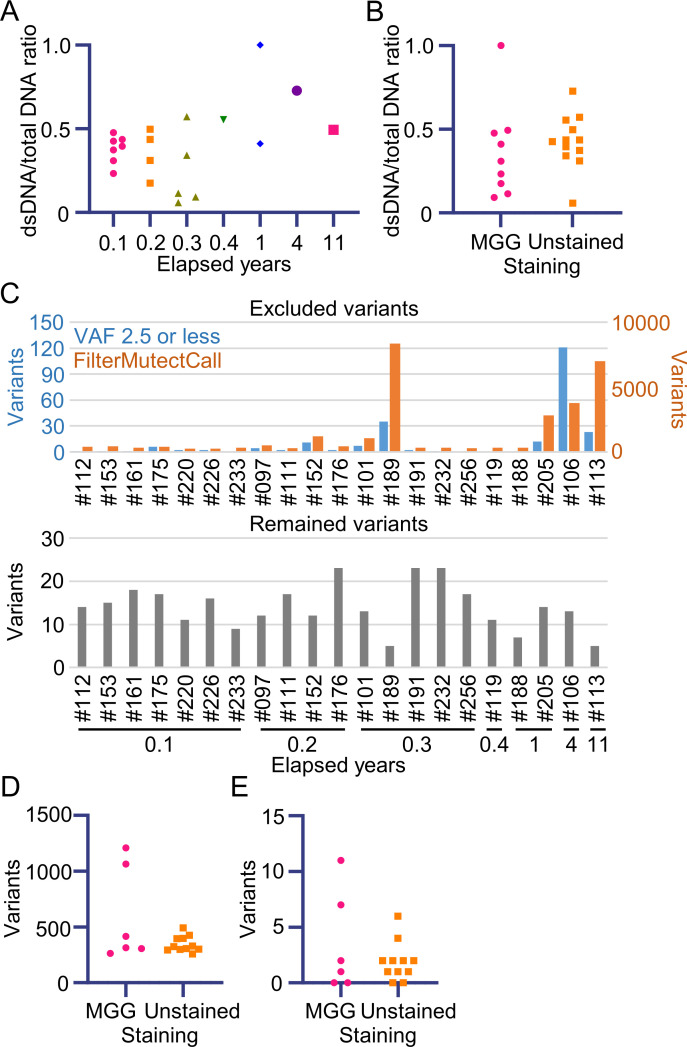
Fig 8. Effect of duration and staining on DNA quality and variant calling in 21 smear samples.
(A) The dsDNA/total DNA ratio was plotted chronologically starting from smear preparation. (B) The dsDNA/total DNA ratio was compared between MGG-stained and unstained smear samples. (C) Bar plot of the amount of filtered and remaining variants. Filtered variants are shown separately by the filtering methods used (FilterMutectCall: orange; VAF 2.5 or less: blue) in the upper panel. Variants after filtering are shown in the lower panel. The quantity of variants removed by FilterMutectCalls (D) and the quantity removed at VAF 2.5 or a lower level of detection (E) were compared between the MGG-stained and unstained smear samples.

