
Fig 2. UV-C light intensity measured within the array.
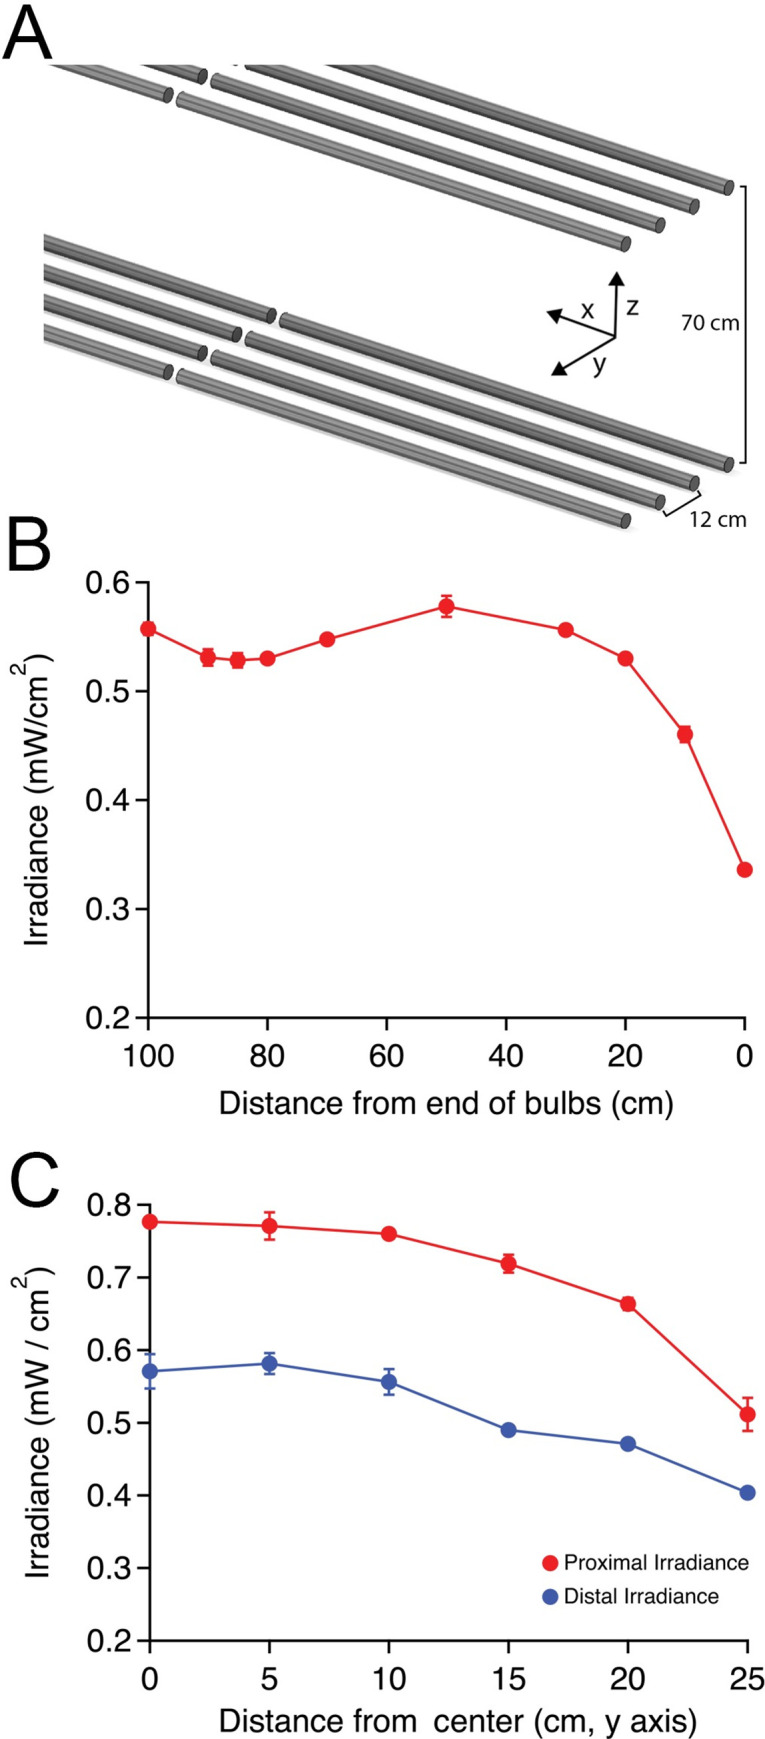
A. Schematic demonstrating array dimensions and axes. B. Light intensity variation along longitudinal stretch of each array beginning at the terminal tombstone (= 0 cm) moving inwards along the x axis between the center bulbs (mean mW/cm2 ± standard deviation, n = 3 at each location). The slight decrease in irradiance at 85–90 cm corresponds to the region between end-to-end bulbs. C. Light intensity variation moving outwards from the center of the linear array (along the y axis), measured at x = 45 cm. Measurements were recorded with dosimeter facing the array at the proximal and distal vertical extents of each hanging FFR (in this case, z = 28 and 42 cm from array), demonstrating decreased light irradiance at both levels when moving away from the middle of the exposure zone (n = 4 measurements per location ± standard deviation).