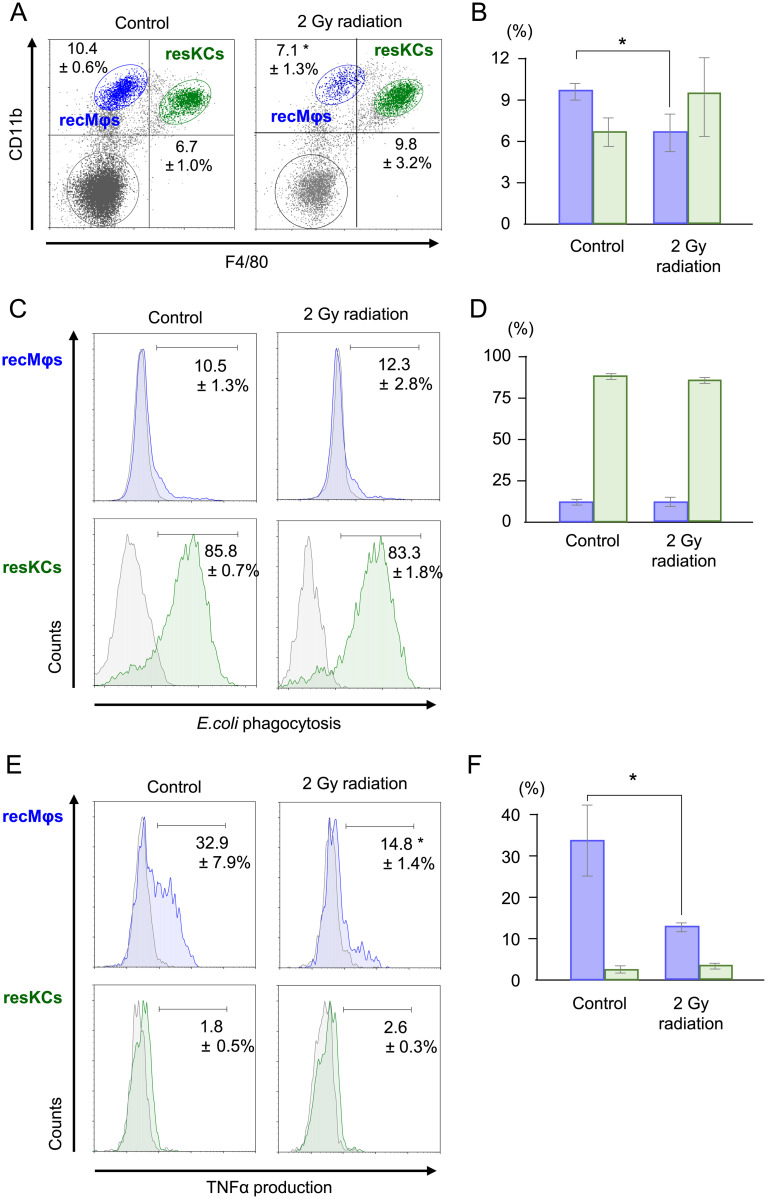
Fig 2. Effect of low-dose irradiation on the proportion and function of resKCs and recMφs in WT mice.
Irradiation-induced changes in the proportion and functions of resKCs and recMφs. Liver MNCs harvested from normal mice and mice 2 days after irradiation (2 Gy) were analyzed. (A) FACS analysis of F4/80 and CD11b in liver MNCs isolated from control and irradiated mice, with recMφs and resKCs displayed as blue and green dots, respectively. (B) Bar graph of recMφ (blue columns) and resKC (green columns) abundance in control and irradiated mice (n = 13 and 6). (C) Phagocytic activity of recMφs (upper panels) and resKCs (lower panels) against intravenously injected FITC-E. coli in mice with or without irradiation. The percentage of FITC-E. coli-positive cells was calculated relative to non-injected control mice (gray area in each panel). (D) Bar graph of E. coli phagocytosis by recMφs (blue columns) and resKCs (green columns) in control and irradiated mice (n = 5 in each group). (E) Intracellular TNF-α production in recMφs (upper panels) and resKCs (lower panels) stimulated with LPS in vitro. Liver MNCs from control or irradiated mice were stimulated with LPS in vitro for 1.5 h, and intracellular TNF-α was labeled (n = 5 in each group). (F) Bar graph of intracellular TNF-α expression in recMφs (blue columns) and resKCs (green columns) in control and irradiated mice (n = 5 in each group). Data are presented as the mean ± SE (*p <0.05, unpaired Student’s t-test).

