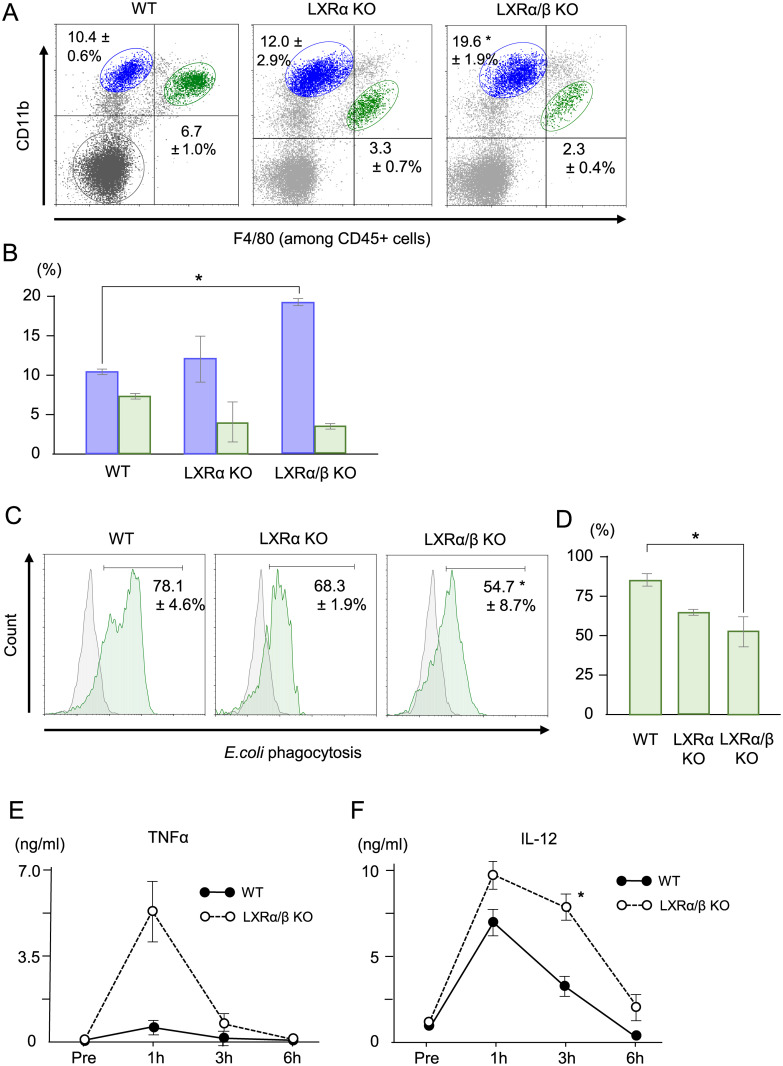
Fig 4. The proportions of resKCs and recMφs, in vivo phagocytic activity of resKCs against E. coli, and plasma inflammatory cytokine levels in WT and LXR-deficient mice.
(A) The proportions of resKCs and recMφs in the livers of WT, LXRα KO, and LXRα/β KO mice were determined via flow cytometry (n = 4 in each group). (B) Bar graph of recMφ (blue columns) and resKC (green columns) proportions in WT, LXRα KO, and LXRα/β KO mice (n = 4 in each group) Data are presented as the mean ± SE (*p <0.05, one-way ANOVA followed by Tukey’s multiple comparisons). (C) In vivo phagocytic activity of WT mice (n = 6), LXRα KO mice (n = 3), and LXRα/β KO mice (n = 3). Mice were injected with FITC-E. coli, and the phagocytic activity of resKCs (green line) was analyzed 15 min after injection. ResKCs from a mouse without E. coli injection were used as negative controls (gray line). (D) Bar graph of the phagocytotic activity of resKCs (green columns) in WT, LXRα KO, and LXRα/β KO mice (n = 6, 3, 3 in each). Data are presented as the mean ± SE (*p <0.05, one-way ANOVA followed by Tukey’s multiple comparisons) (E, F) WT mice and LXRα/β KO mice were injected with live E. coli, and plasma TNF-α and IL-12 levels were measured at the indicated time points after E. coli injection (n = 3 in each group). Data are presented as the mean ± SE. (*p <0.05, unpaired Student’s t-test).

