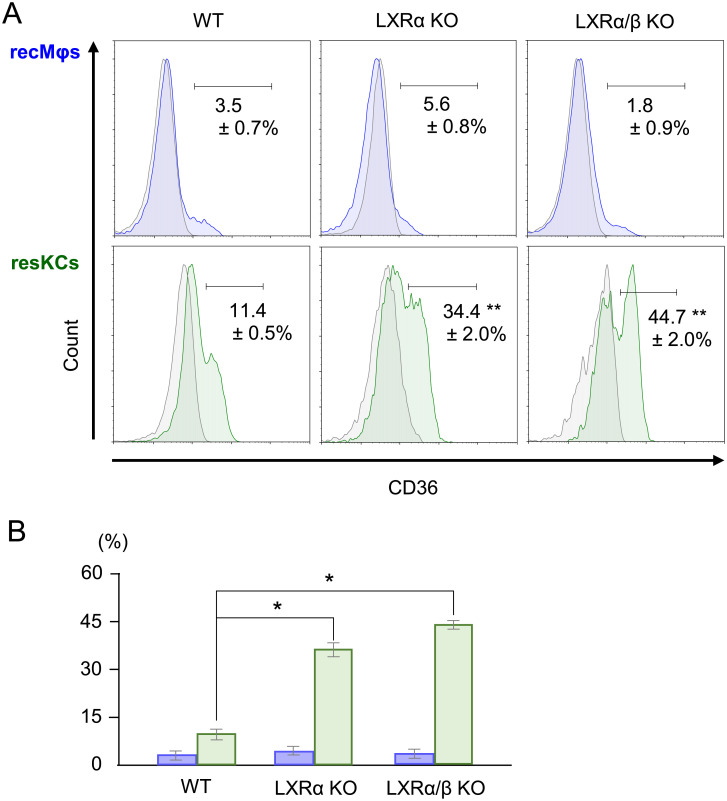
Fig 7. CD36 expression in resKCs and recMφs from WT, LXRα, and LXRα/β KO mice.
(A) The expression of CD36 on recMφs and resKCs from WT, LXRα, and LXRα/β KO mice (n = 4 in each group) was analyzed and compared. (B) Bar graph of CD36+ cells among recMφs (blue columns) and resKCs (green columns). Data are presented as the mean ± SE. (*p <0.05, one-way ANOVA followed by Tukey’s multiple comparisons test).

