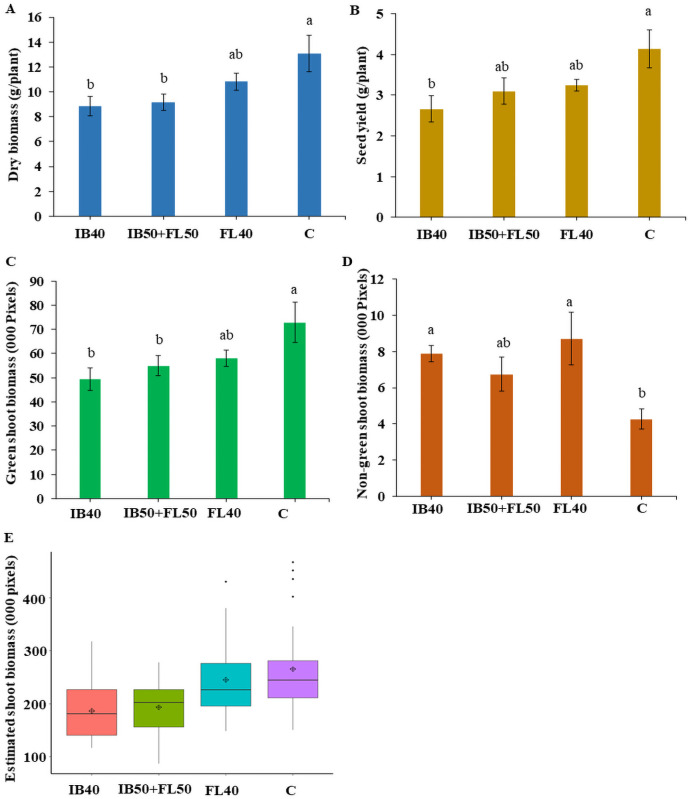
Fig 4. Performance of safflower genotypes under four different drought treatments.
(A) Dry biomass for all four genotypes at the time of the maturity (g/plant). (B) Seed yield for all four genotypes at harvest (g/plant). (C) Estimated green shoot biomass and (D) estimated non-green shoot biomass from digital image analysis during flowering period. (E) Total estimated digital shoot biomass at end of imaging. C—control; TB40–40% field capacity (FC) at initial branching (IB); FL40–40% FC at flowering (FL); IB50+FL50–50% FC at both IB and FL. Each stress treatment was compared against the control. Data show mean + SEM. Different letters above each bar in the bar chart indicate significant differences between treatments (p < 0.05). The boxes in the boxplot represent lower and upper quartile, vertical lines attached to each bar is whisker. The black horizontal line indicates median; diamond plus represents mean.

