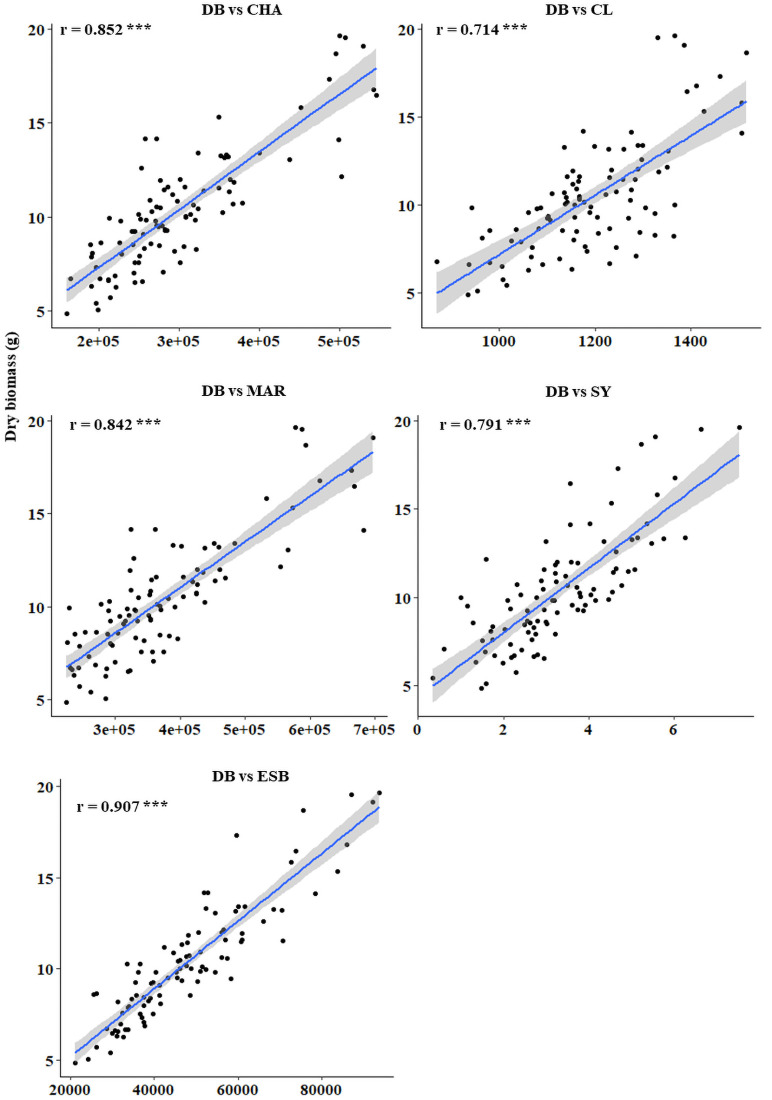
Fig 5. Correlations between dry biomass with other plant traits calculated from the screening of 200 diverse safflower genotypes.
DB. dry biomass; CHA, convex hull area, CL. caliper length, MAR. minimum area rectangle; SY. seed yield; ESB. estimated shoot biomass; r, coefficient of correlation. Blue line indicates the line of best fit as a result of linear regression. The grey shaded area represents the confidence interval. The asterisks show the significance level (*** p< 0.001).

