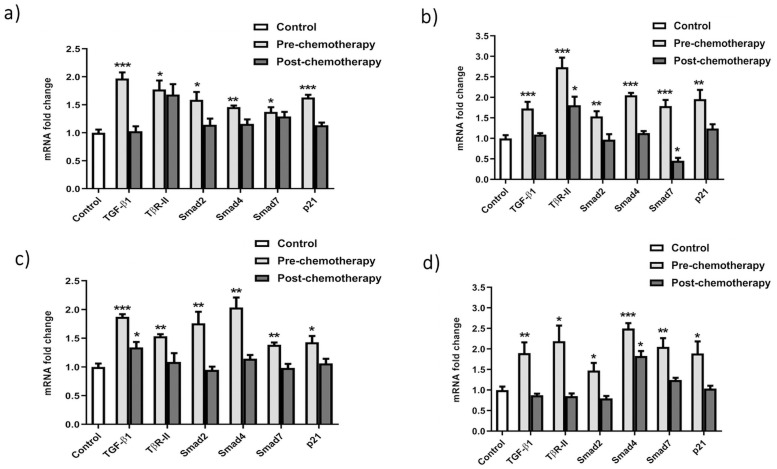
Fig 4. TGF-β cascade expression profiling in a) G-II blood samples b) G-II biopsy samples c) G-III blood samples d) G-III biopsy samples.
The relative quantification results indicate the expression pattern of TGF-β pathway genes in G-II and GIII breast cancer clinical samples based on chemotherapy status. All the experiments were performed in triplicates. Error bars show ±SD. ANOVA test was applied to the data at *P<0.05, **P<0.001, ***P<0.0001.

