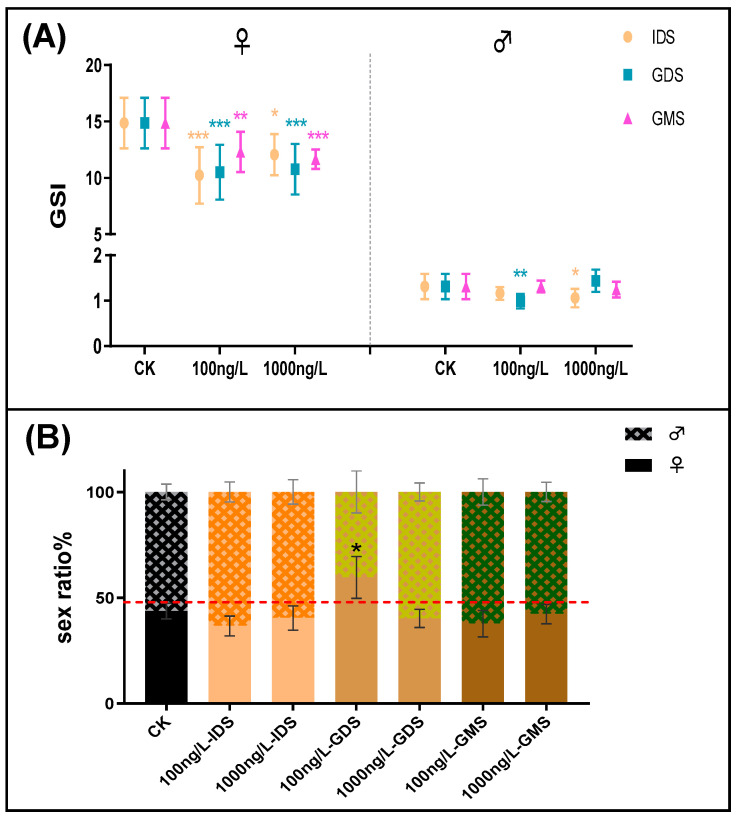
Figure 2.
(A) Gonadosomatic index (GSI) of zebrafish at 90 dpf for every group. (n = 15 fish per replicate at 90 dpf). (B) Sex ratio of zebrafish at 90 dpf for every group. (n = 6 fish per replicate at 90 dpf). Values are shown as mean ± SD (n = 3 replicates per treatment). Asterisks denote significant differences between control and treatments (* p < 0.05, ** p < 0.01, and *** p < 0.005, according to Dunnett’s multiple comparisons test). CK-control group.

