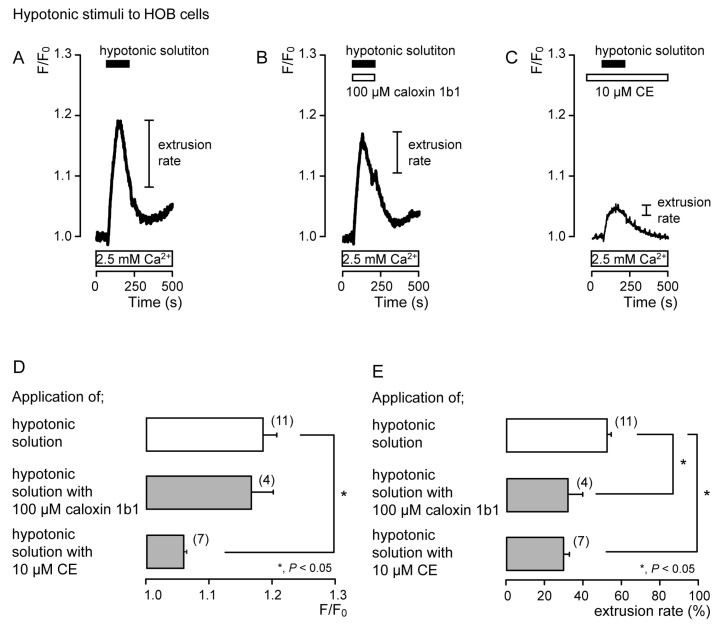
Figure 3.
PMCA mediates Ca2+ extrusion following hypotonic stimuli in HOB cells. (A–C) Representative traces of [Ca2+]i following hypotonic stimuli (black boxes at tops of graphs) in the absence of 100 μM caloxin 1b1 and 10 μM CE (A), with 100 μM caloxin 1b1 (white box at the top) (B), or with 10 μM CE (white box at the top) (C), in the presence of extracellular Ca2+ (white boxes at bottom in A to C). (D) Peak values of [Ca2+]i during hypotonic stimuli without 100 μM caloxin 1b1 and 10 μM CE (open column; 1.19 ± 0.02 F/F0 units), with 100 μM caloxin 1b1 (upper gray column; 1.17 ± 0.03 F/F0 units), and with 10 μM CE (lower gray column; 1.06 ± 0.00 F/F0 units). Each column denotes the mean ± SE from 11, 4, and 7 independent experiments, respectively. (E) Ca2+ extrusion rates during hypotonic stimulation in the absence of 100 μM caloxin 1b1 and 10 μM CE (open column; 53.4 ± 2.2%), with 100 μM caloxin 1b1 (upper gray column; 32.4 ± 7.3%), and with 10 μM CE (lower gray column; 29.7 ± 3.0%). Each column denotes the mean ± SE from 11, 4, and 7 independent experiments, respectively. Statistically significant differences (in (D,E)) between columns (shown by solid lines) are indicated by asterisks. * P < 0.05.

