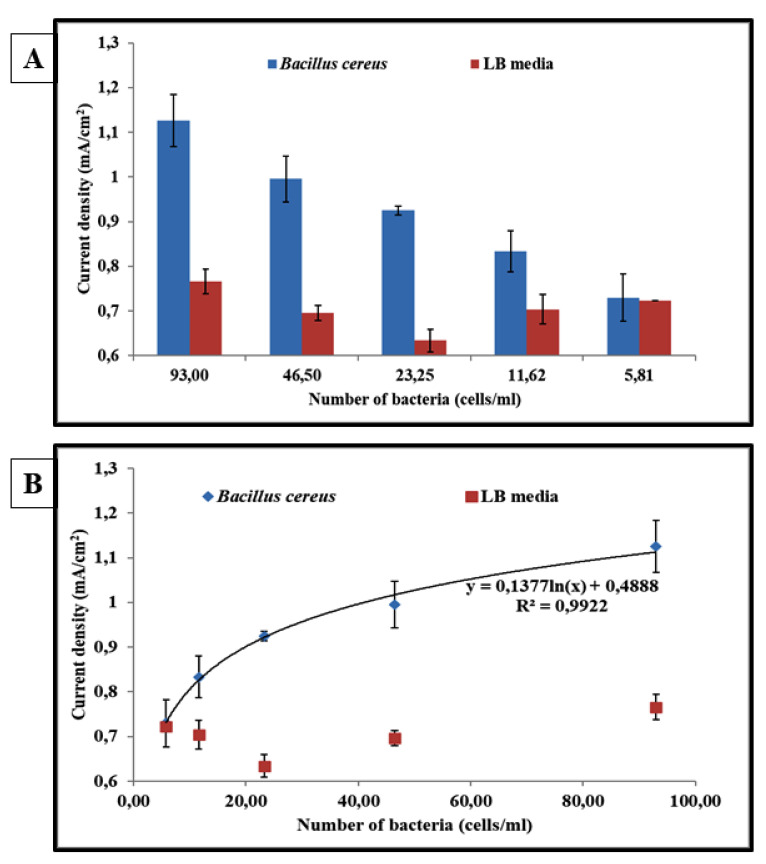
Figure 5.
Diagrams correspond to the response of the centri-chronoamperometric assay to various B. cereus concentrations ranging from 6 cells/mL to 93 cells/mL (blue) and to various concentrations of noninoculated LB media in 1 M HCl solution (red) (A). Response corresponds to the electrocatalytic signal highlighting the bacterial detection. The curve indicates the fitting of the experimental data with a logarithmic regression: current density = 0.1377 × ln (B. cereus concentration) + 0.4888 (R2 = 0.9922) (B).

