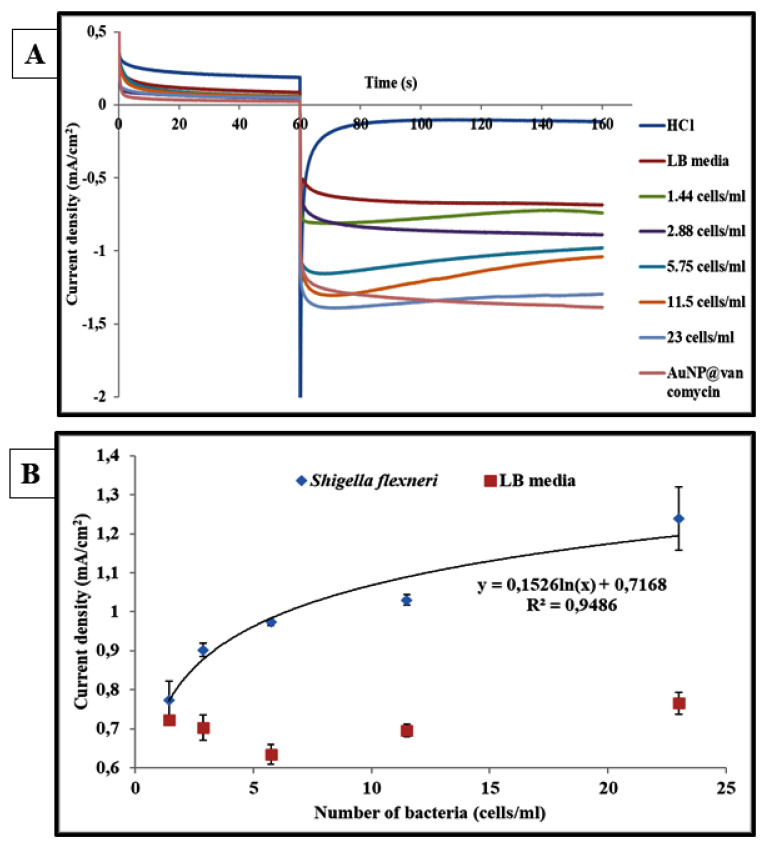
Figure 6.
Chronoamperometric curves correspond to the response of the centri-chronoamperometric assay without bacteria (noninoculated LB media) and with various S. flexneri concentrations: 1.44, 2.88, 5.75, 11.5, and 23 cells/mL (A). Biosensor response to various concentration of S. flexneri. The curve indicates the fitting of the experimental data with a logarithmic regression (current density) = 0.1526 × ln (S. flexneri concentration) + 0.7168 (R2 = 0.9486) (B).

