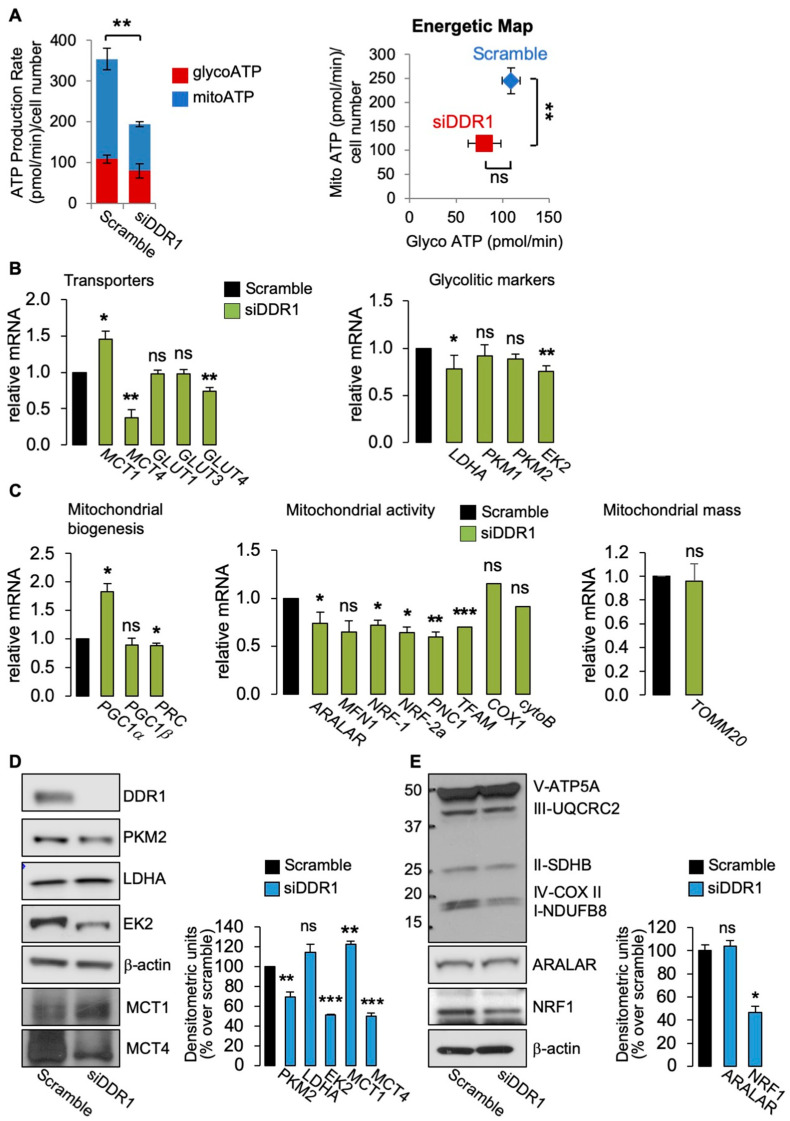
Figure 2.
(A) ATP production rate in MCF7/IGF2 cells silenced for DDR1 and in control cells treated with scramble siRNAs. Glycolytic ATP (red columns-glycoATP) and the mitochondrial (blue columns—mitoATP) production rates were evaluated according to the manufacturer’s instructions (Agilent ATP test). OCR and ECAR were first measured in basal conditions. Injection of oligomycin resulted in inhibition of mitochondrial ATP synthesis and decrease in OCR, allowing the mitoATP production rate to be quantified. Complete inhibition of mitochondrial respiration with rotenone plus antimycin A accounting for mitochondrial-associated acidification allowed the calculation of the glycoATP production rate. The presented histogram (left panel) and the energetic map (right panel) show the mean and range from three independent experiments. (B) Glycolysis related markers: MCF7/IGF2 cells transiently transfected with an siRNA for DDR1 (green columns) or scramble siRNAs (black columns) were processed for mRNA expression of glycolysis-related transporters: MCT1, MCT4, GLUT1-4 (left panel), and enzymes LDHA, PKM1, PKM2, and EK2 (right panel). (C) OxPhos related markers in MCF7/IGF2 cells silenced for DDR1 (green columns) or treated with scramble siRNAs (black columns). Markers of mitochondrial biogenesis (PGC1α, PGC1β, PRC) (left panel), and mitochondrial markers (ARALAR, MFN1, NRF-1, NRF-2a, TFAM, and PNC1) (middle panel) were measured by qRT-PCR analysis. Mitochondrial activity was evaluated by mRNA expression levels of COX1 and cytoB (middle panel), and mitochondrial mass was assessed by measuring mRNA levels of mitochondrial outer membrane protein (TOMM20) (right panel). GAPDH was used as housekeeping control gene. Values are expressed as the means ± SEM of three separate experiments. (D) Western blot of selected glycolysis related molecules (PKM2, LDHA, MCT1, MCT4, and EK2) in MCF7/IGF2 cells silenced for DDR1 or treated with scramble oligonucleotides (left panel) and densitometric analysis of results obtained in three independent experiments (right panel). (E) Western blot with OxPhos antibodies cocktail against mitochondrial complexes showed a decrease of mitochondrial complex IV and I. NRF1 protein was also markedly decreased, whereas ARALAR did not show significant changes. Graphs represent the mean ± SEM of densitometric analysis of three independent experiments, where values were normalized to β-actin. (ns, not significant; *, p < 0.05; **, p < 0.01; ***, p < 0.001; Student’s t-test).

