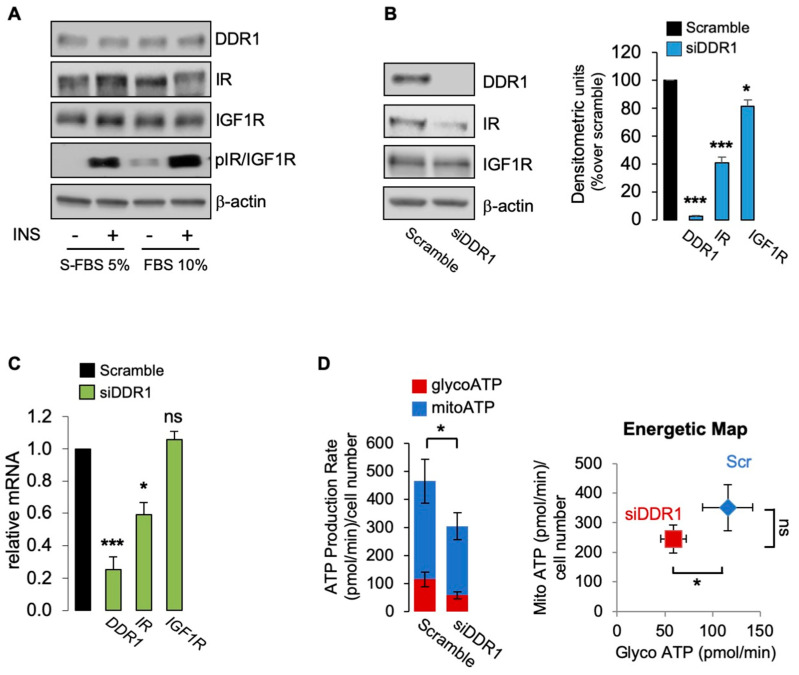
Figure 6.
(A) MCF7 cells grown in 5% charcoal stripped fetal bovine serum (S-FBS) and in 10% FBS were stimulated with vehicle (-) or insulin (10 nM for 5 min), and IR/IGF1R phosphorylation evaluated by Western blotting analysis using anti-phospho-(p)IGF1R (Tyr1135/1136)/pIR (Tyr1150/1151) antibody. β-actin was used as control for protein loading. Blots are representative of three independent experiments. The histograms represent the mean ± SEM of densitometric analysis of three independent experiments; (B) MCF7 cells cultured in S-FBS were transiently transfected with siRNA to DDR1 or scramble siRNAs. After 48 h, cells were lysed and analyzed by SDS-PAGE and immunoblotted with the indicated primary antibodies. β-actin was used as control for protein loading. Blots are representative of three independent experiments. The histogram represents the mean ± SEM of densitometric analysis of three independent experiments. (C) Cells cultures as in (B) were analyzed for DDR1, IR, and IGF1R mRNAs expression by qRT-PCR analysis. Normalization was done using human GAPDH as housekeeping control genes. Data are presented as the mean ± SEM (error bars) from three independent experiments; (D) ATP production rate in MCF7 cultured in 5% S-FBS silenced for DDR1 and in control cells treated with scramble siRNAs. The presented histogram (left panel) and the energetic map (right panel) show the mean and range from three independent experiments. (ns—not significant; *, p < 0.05; ***, p < 0.001).

