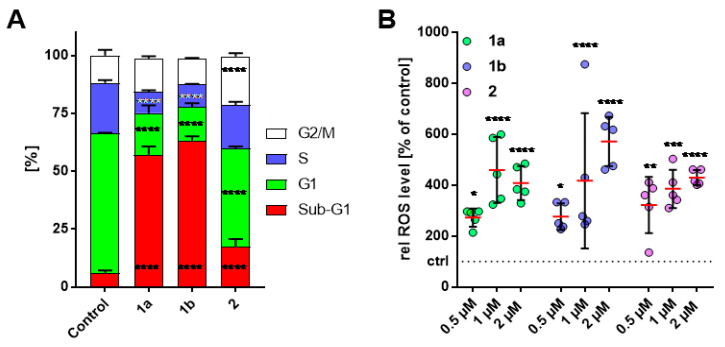
Figure 4.
(A) Effect of 1a, 1b and 2 (1 µM) on the cell-cycle of HT-29 colorectal adenocarcinoma cells after 24h of treatment. Negative controls were treated with an equivalent amount of solvent (DMSO). Box-plot of the quantification (mean ± SD) of the cell cycle distribution of HT-29 cells after treatment with 1a, 1b or 2 of three independent assays. The measurements were performed in triplicate and quoted as means ± SD (n = 9 per group). (B) Levels of reactive oxygen species (ROS) in HT-29 colon adenocarcinoma cells after treatment with 1a, 1b and 2 (0.5, 1, 2 µM) for 1 h determined by fluorescence-based DCFH-DA assay. The values are mean values ± SD from at least five independent experiments with negative control treated with an equivalent amount of solvent and set to 100% (dashed line; ctrl) (n = 5 per group). *: p < 0.05; **: p < 0.01; ***: p < 0.001; ****: p < 0.0001 against control for each cell cycle phase, Two-way ANOVA with Dunnett’s multiple comparison test (GraphPad Prism 7).

