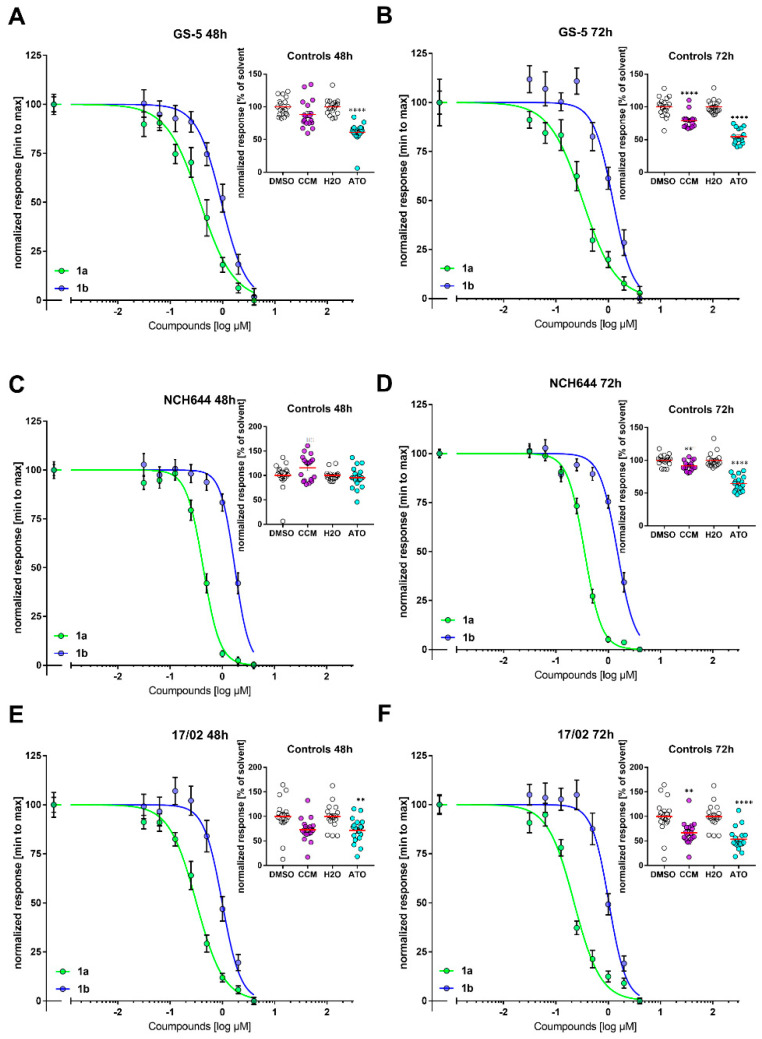
Figure 7.
Concentration-dependent decrease in cell viability of the conventional GSC sphere cultures GS-5, NCH644 and the primary culture 17/02. MTT-assay of (A,B) GS-5, (C,D) NCH644 and (E,F) 17/02 GSCs treated for (A,C,E) 48 h or (B,D,F) 72 h with compounds as indicated. The data were normalized from highest (100%) to lowest (0%) and plotted against the log-dose of the compounds. To calculate the IC50-values (Table 4) a curve-fitting was done using the function “log(inhibitor) vs. normalized response Variable slope” without constraints (GraphPad Prism 7). As positive controls, the cells were treated with 20 µM Curcumin (CCM) or solvent (DMSO) or 2.5 µM arsenic trioxide (As2O3, ATO) or solvent (H2O) for the same amount of time (Inserts in A to D). The data presented is the summary of three independent experiments performed in 6 replicates (n = 18 per group). **: p < 0.01; ****: p < 0.0001; Unpaired t test with Welch’s Correction (GraphPad Prism 7).

