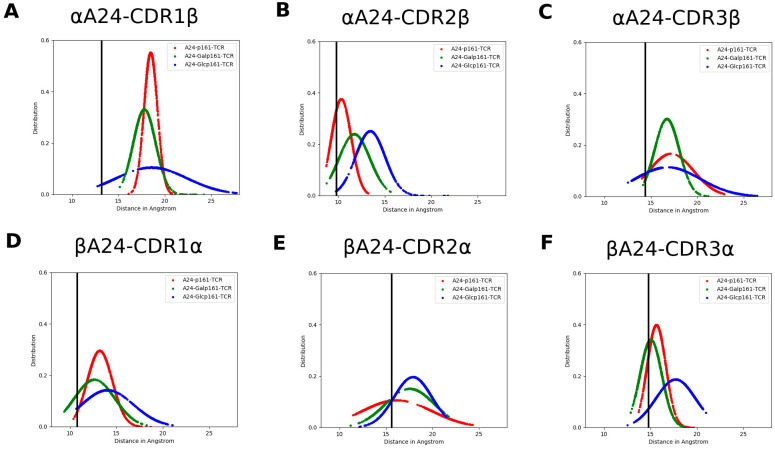
Figure 5.
The distance distribution between A24 and TCR, namely (A) αA24 and CDR1β, (B) αA24 and CDR2β, (C) αA24 and CDR3β, (D) βA24 and CDR1α, (E) βA24 and CDR2α, and (F) βA24 and CDR3α in the MD simulations of the A24-peptide-TCR complexes where the peptides are p161 (red), Galp161 (green), and Glcp161 (blue). The black line is the corresponding distance in the crystal structure of the A24-HIV-TCR complex (PDB ID: 3VXU).

