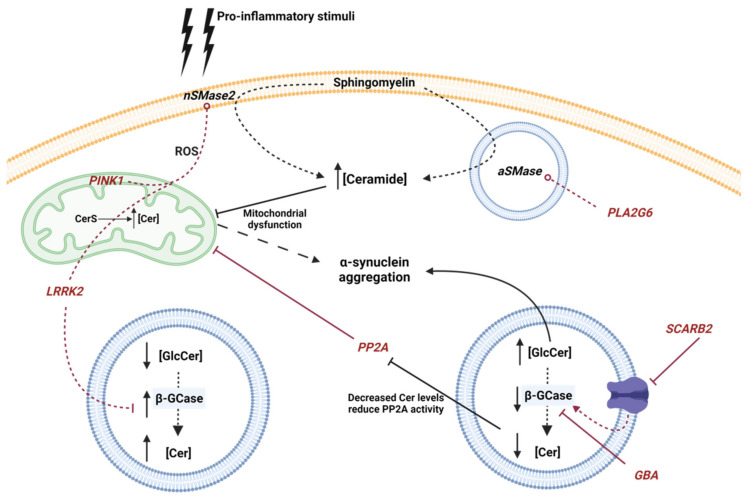
Figure 2.
Schematic representation of the influence of genetic mutations involved in PD with Cer metabolism. Genes are represented in italics and red color. Red lines circled at the end indicate increased activity, while a traversed lines at the end indicate inhibition or dysfunction. Neutral Sphingomyelinase 2 (nSMase2), acid sphingomyelinase (aSMase), Ceramide Synthase (CerS), acid β-glucosidase (β-GCase), Ceramide (Cer), GlucosylCeramide (GlcCer) and reactive oxygen species (ROS) are represented by their acronyms.

