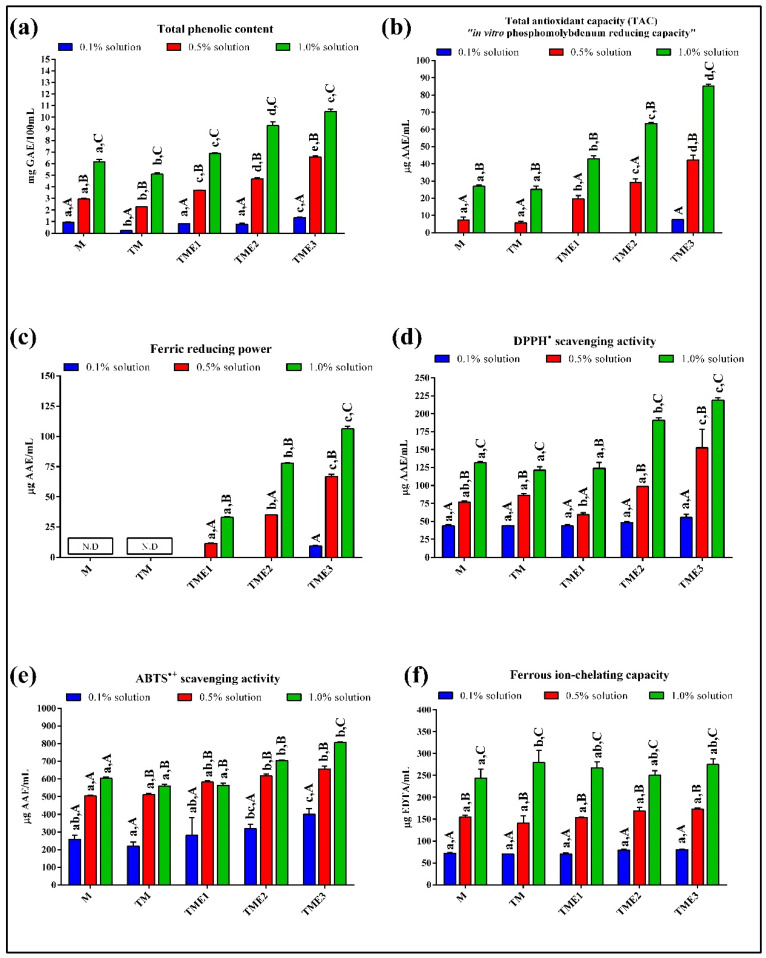
Figure 2.
Total phenolic content (a) and antioxidant properties (b–f) of milk and milk/seed extract powders: (b) Phosphomolybdenium (TAC) assay; (c) Ferric reducing power; (d) DPPH• scavenging activity; (e) ABTS•+ scavenging activity; and (f) Ferrous chelating capacity. The bars with (±) standard deviation represent mean values. Lowercase letters indicate comparisons of different samples for each concentration level; uppercase letters indicate comparisons within each sample among different concentration levels. Different letters indicate statistically significant differences according to Tukey’s test (p < 0.05). “N.D.”—not detected.

