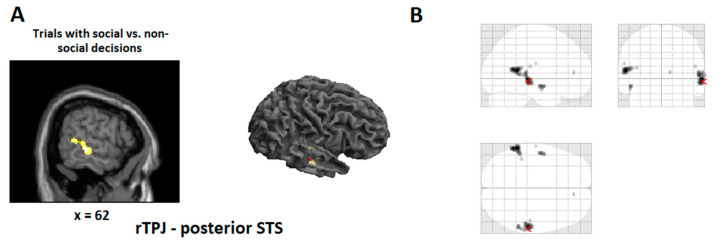
Figure 3.
Statistical maps showing brain activation for trials with social relative to non-social decisions. (A): Areas of significant fMRI signal change are shown as color overlays on the T1-MNI reference brain (at p < 0.005, uncorrected, for picture purpose only). (B): Glass brain depicting same contrast as in A (at p < 0.005, uncorrected). Even at the very lenient threshold of p < 0.005 (uncorrected) we found no anterior insula activation.

