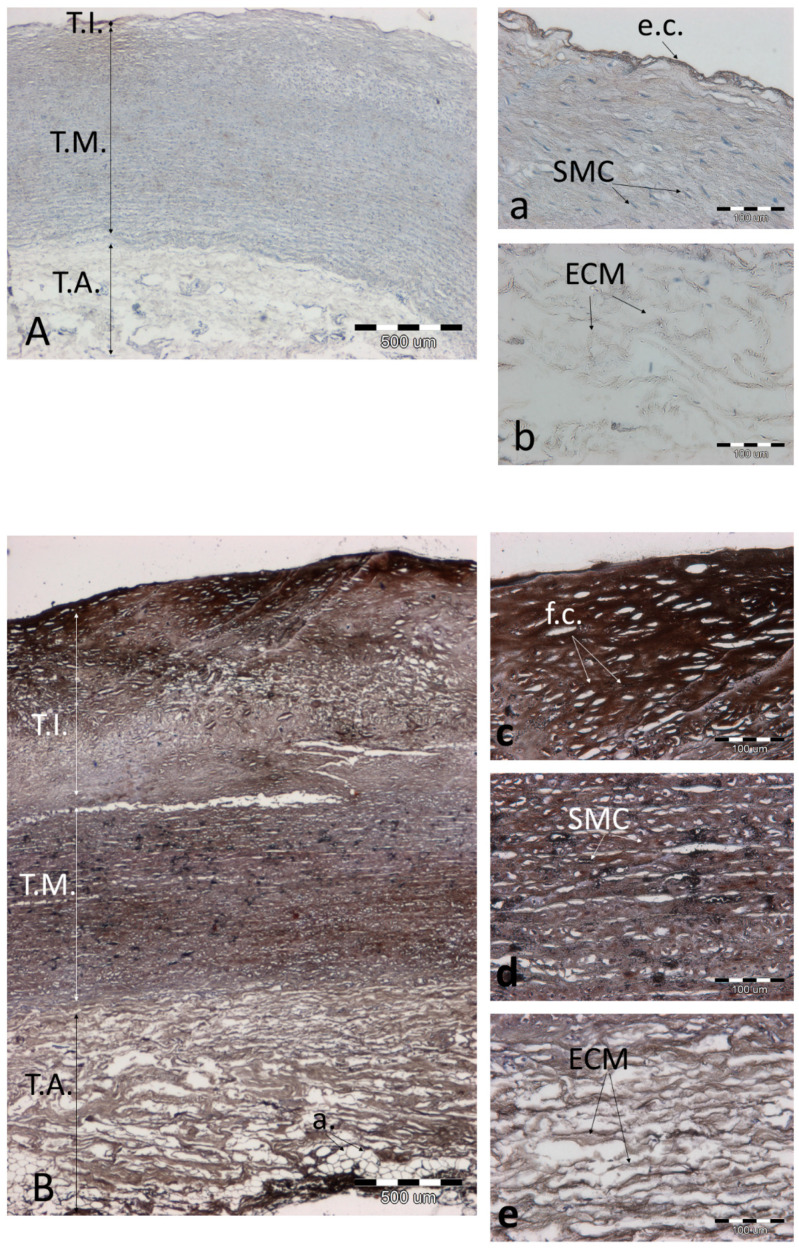
Figure 9.
The effect of von Kossa staining in a representative aorta at a low level of atherosclerosis (A(a,b)) and an aorta at a high degree of atherosclerosis (B(c–e)). (A,B)—the entire aortic section, 40× magnification, scale bar 500 µm; (a–e)—magnification 200×, scale bar 100 µm. Abbreviations in figures: T.A.—tunica adventitia; T.I.—tunica intima; T.M.—tunica media; ch.c.—cholesterol clefts; v.v.—vasa vasorum; f.c.—foam cells; SMC—smooth muscle cells; e.c.—endothelial cells; a.—adipocytes; ECM—extracellular matrix; MP—macrophages.

