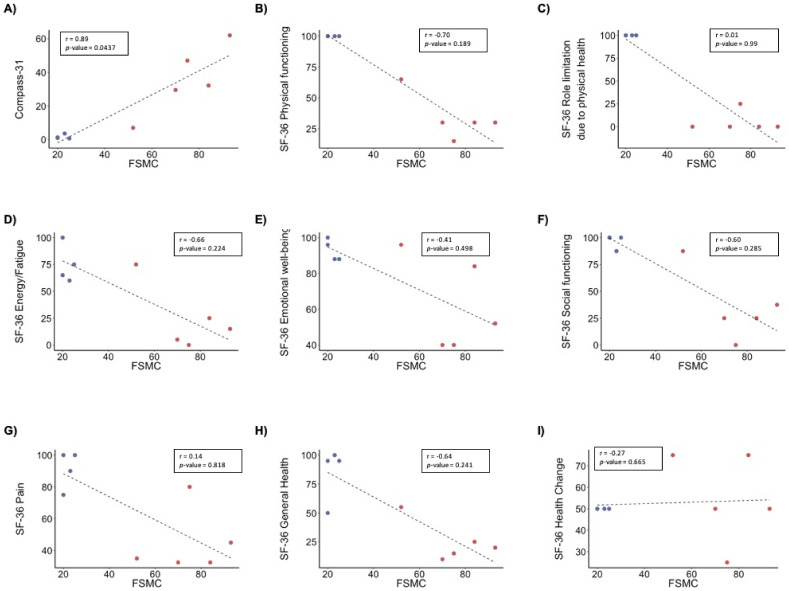
Figure 1.
Correlation analyses of self-assessed fatigue in ME/CFS patients and controls. Pearson correlation analysis of FSCM total score with: (A) compass-31, (B) SF-36 physical functioning, (C) SF-36 role limitation due to physical health, (D) SF-36 energy and fatigue, (E) SF-36 emotional well-being, (F) SF-36 social functioning, (G) SF-36 pain, (H) SF-36 general health, and (I) SF-36 health change. p-values and Pearson (r) values were generated using Pearson’s correlation analysis. n = 10 (4 controls, 6 ME/CFS patients). Blue dots, controls; red dots, ME/CFS patients. n = 9 (4 controls, 5 ME/CFS patients).

