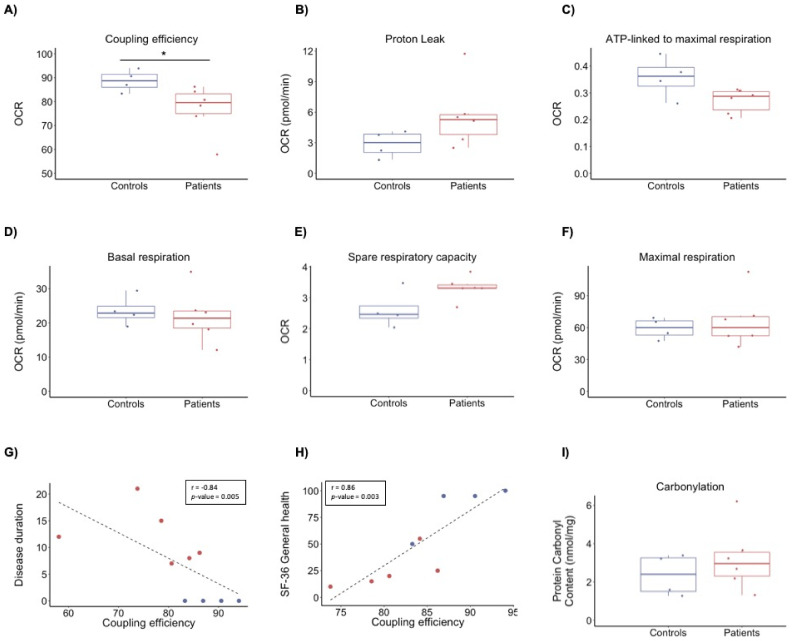
Figure 2.
Bioenergetics profile of PBMCs from ME/CFS patients and healthy individuals as controls. Rates of mitochondrial respiration were measured in PBMCs using the Seahorse XFe96 instrument with added glucose, pyruvate, and glutamine. (A) Coupling efficiency (%) calculated as the ratio of ATP-linked respiration to basal respiration. (B) Proton leak calculated after the addition of oligomycin. (C) ATP-linked to maximal respiration calculated as the ratio of ATP-linked respiration to maximal respiration. (D) Basal mitochondrial respiration rates calculated before the addition of inhibitors. (E) Spare respiratory capacity calculated as the ratio of maximal respiration to basal. (F) Maximal respiration calculated after uncoupling of the respiratory chain by the addition of FCCP. (G) Pearson’s correlation between disease duration (y-axis) and coupling efficiency (x-axis) for all 10 individuals. (H) Pearson’s correlation between SF-36 general health (y-axis) and coupling efficiency (x-axis) for 9 individuals. The data of one patient lacks due to incompletion of the questionnaires. (I) Box plots representing the cellular levels of oxidative protein damage. Blue bar, controls; red bar, ME/CFS patients. n = 10 (4 controls, 6 ME/CFS patients). p-values denote significance from Student’s t-test. * p < 0.05.

