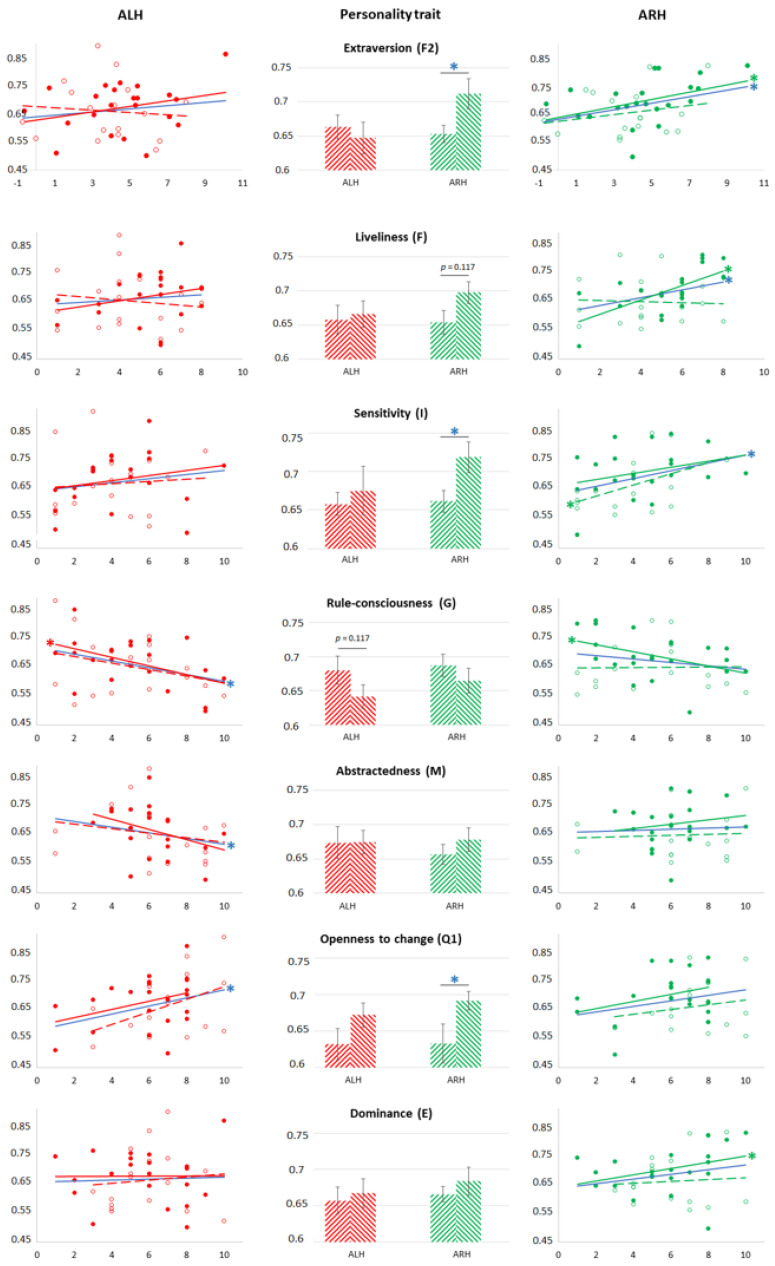
Figure A1.
Left and right columns of plots represent the correlation fields between the factor score and the classification accuracy of brain signals during imagination of movements of LH comparative to the rest (ALH, left column) and of RH comparative to the rest (ARH, right column). Filled points and solid trend lines represent the values for “pure” right-handers; empty points and dotted trend lines represent latent left-handers. Significant Pearson’s or Spearman’s correlations (p < 0.05) are marked with an asterisk (*) (red asterisks stand for ALH in the group of “pure” right-handers or latent left-handers, green stand for ARH, and blue represent ALH or ARH among all participants). The factors are specified on the top of the middle plots. The middle column of the plots represents mean ALH (red columns) and mean ARH (green columns) for the subgroups of participants with the low factor score (low expression of the personality trait; left columns) and with the high score (high expression of the personality trait; right columns). Significant Mann-Whitney’s correlations (p < 0.05) are marked with blue asterisks (*), p-value is indicated in the case of trend.

