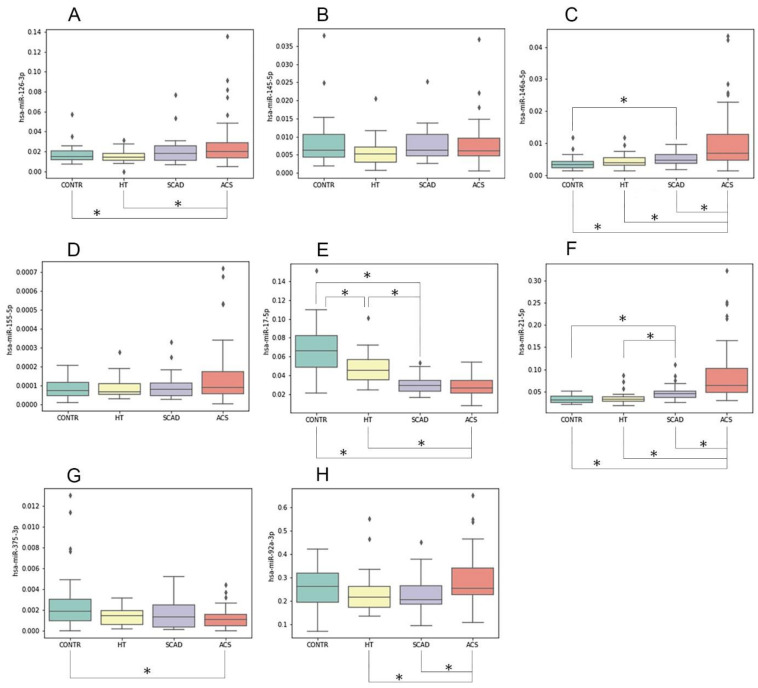
Figure 3.
Relative miRNA plasma levels in the study sample groups: ACS, 50 ACS patients; SCAD, 26 patients with stable CAD; HT, 30 hypertensive patients without CAD; CONTR, 30 healthy controls. On the y-axis, relative plasma levels (normalized to miR-16-5p) are shown for miRNAs: miR-126-3p (A); miR-145-5p (B); miR-146a-5p (C); miR-155-5p (D); miR-17-5p (E); miR-21-5p (F); miR-375-3p (G); miR-92a-3p (H). The boxplots represent median and interquartile ranges (IQRs) in the box, minimum and maximum values in the “whiskers”, and outliers in the dots. Asterisks indicate differences in relative miRNA plasma level in the group pairwise comparisons (Mann–Whitney test, * p < 0.05).

