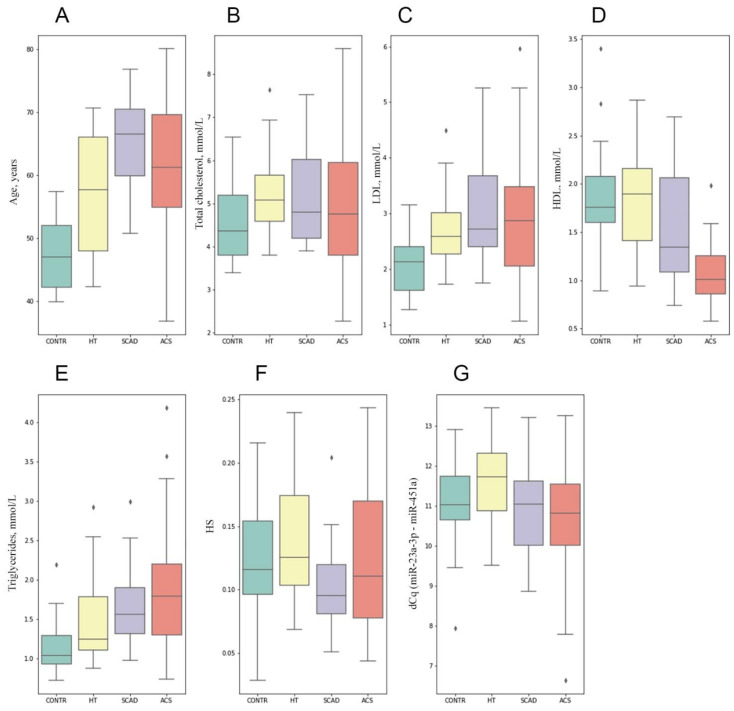
Figure A1.
Distribution plots of the study sample characteristics—age (A), total cholesterol (B), LDL (C), HDL (D), triglycerides (E), HS (F), and dCq (miR-23a-3p–miR-451a) (G)—in the study sample groups: ACS, 50 ACS patients; SCAD, 26 patients with stable CAD; HT, 30 hypertensive patients without CAD; CONTR, 30 healthy controls. The boxplots represent median and interquartile ranges (IQRs) in the box, minimum and maximum values in the “whiskers”, and outliers in the rhombic dots. LDL, low-density lipoproteins; HDL, high-density lipoproteins; HS, hemolysis score; dCq (miR-23a-3p–miR-451a), Cq difference between miR-23a-3p and miR-451a.

