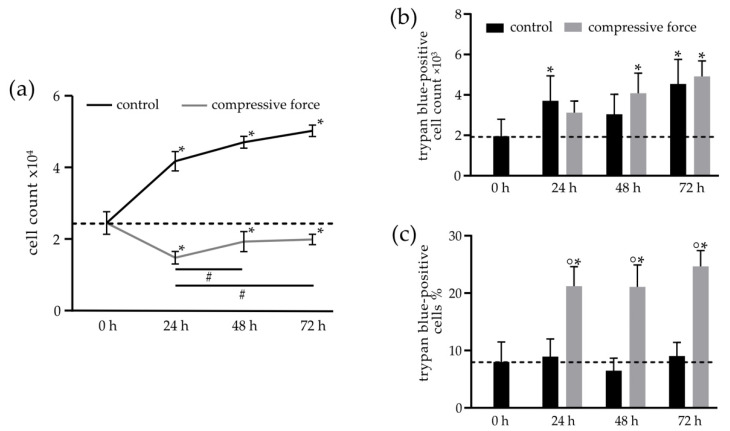
Figure 2.
Influence of the compressive force (CF) on the cell count and cell death rate, examined by trypan blue staining. (a) Quantification of the total cell numbers ×104 in the control (C) and CF groups at 0–72 h. After 24 h, there was a significant reduction in cell numbers compared to the 0-h control in the CF group. Subsequently, the population recovered and approached the baseline value of 0 h again. (b) The total number of trypan blue-positive cells increased significantly in both the C and CF groups compared to the 0-h time point. (c) A higher percentage of trypan blue-positive cells over the entire study period and unchanged percentage of dead cells in the C group. Bars indicate the mean values ± standard deviations. A p-value of p < 0.05 was considered statistically significant. (*) Comparison of the 24-h, 48-h and 72-h (C and CF) time points with the 0-h control. (°) Comparison of the CF with the respective controls of the time points. (#) Comparisons between different compressive force time points.

